Calico Cloud Free Tier
Learn about the observability tools available to you when you connect your Calico Open Source cluster to the Calico Cloud Free Tier web console.
About Calico Cloud Free Tier
Calico Cloud Free Tier provides essential observability tools for understanding and securing your Kubernetes cluster. With these tools, you can monitor network traffic, visualize service interactions, and gain insights into the behavior of your network policies.
A free account with Calico Cloud allows you to connect one cluster to the free-tier web console. The cluster must be running Calico Open Source 3.30 or later.
Features available in the free-tier web console are similar to those in the pro-tier console, but with some limitations.
For example, you can view your network policies, but you cannot edit them directly in the console, as you can with Calico Cloud Pro.
As a general rule, the free-tier console allows you to view what's going on in your cluster.
To make changes, such as creating or editing policies, you must use kubectl commands in your cluster.
What happens when you connect your cluster?
Calico Open Source 3.30 introduced a new component, Goldmane, which exposes a gRPC API with aggregated flow logs from your cluster. This is the data source that feeds Calico Whisker, an in-cluster web console that displays a stream of flows.
Calico Cloud Free Tier uses the same flow logs API to receive data from your cluster.
When you connect your cluster to Calico Cloud Free Tier, you apply manifests that establish a secure connection to the Calico Cloud management cluster.
These manifests create a ManagementClusterConnection resource in your cluster, which specifies the address of the Calico Cloud management cluster, and two Secret resources that provide certificates for secure communication.
Unlike Whisker, which can only display a stream of flows in real time, Calico Cloud Free Tier collects and retains flow logs for a 24-hour period. You can sign in to the console at any time to view data from the last 24 hours. If you choose to disconnect and remove your cluster from the console, your data is deleted after a day.
And because you're not installing anything complicated in your cluster, you can easily remove the resources and restore you cluster to its previous state.
Feature overview
Calico Cloud Free Tier provides a set of observability features that help you monitor and manage your cluster's network traffic.
Dashboards
Dashboards help you see and understand the activity in your cluster using categorized graphs and charts. They visually represent data from your logs, providing a birds-eye view of cluster health, traffic volume, DNS activity, and performance metrics. This allows for quick assessment of the overall state of your cluster's network.
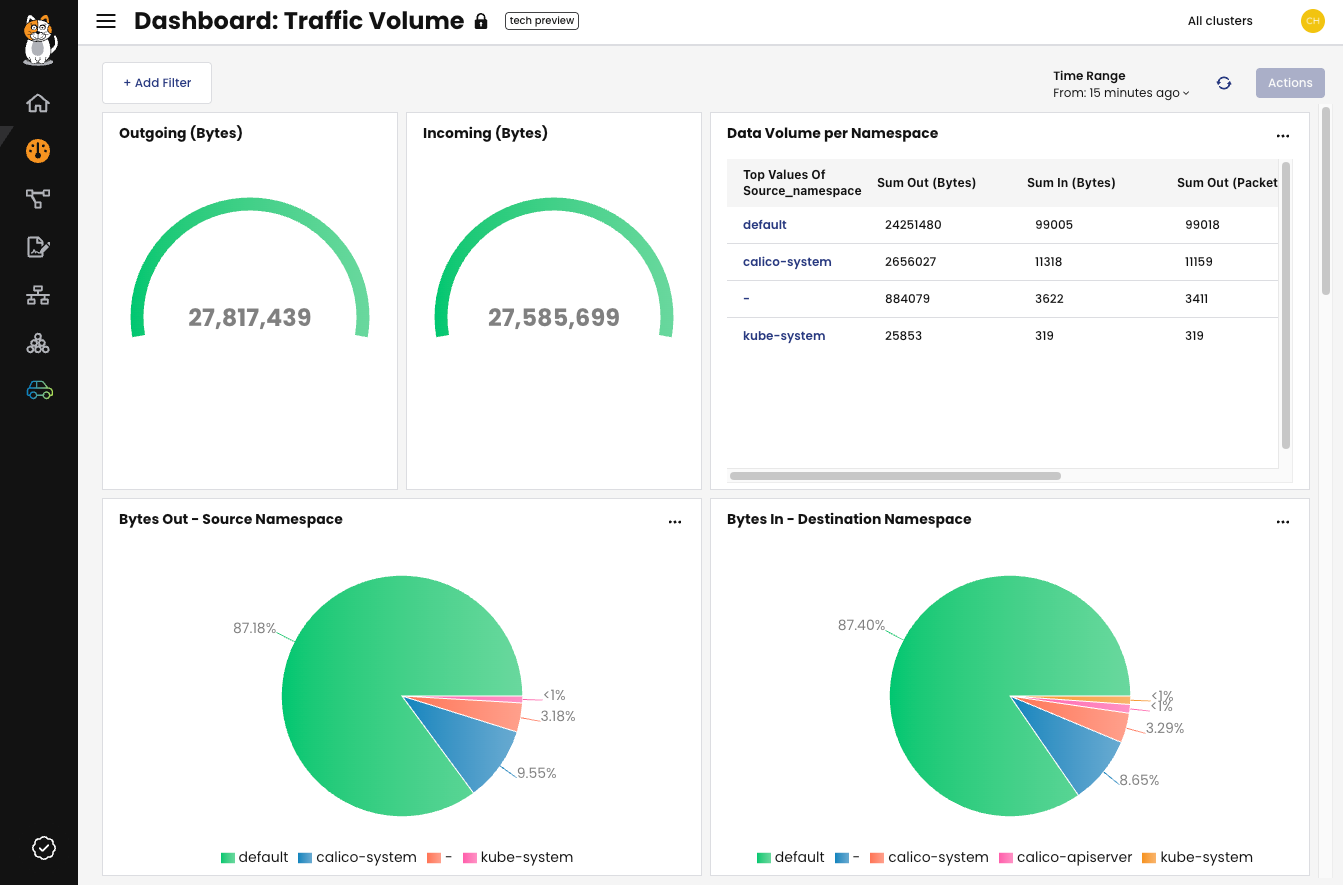
Figure 1: The traffic volume dashboard
Service Graph
Service Graph provides a point-to-point, topographical representation of network traffic within your cluster. It serves as the primary tool for visualizing how services communicate and for troubleshooting connectivity issues. You can click on nodes or connections to see detailed information and associated logs for targeted analysis.
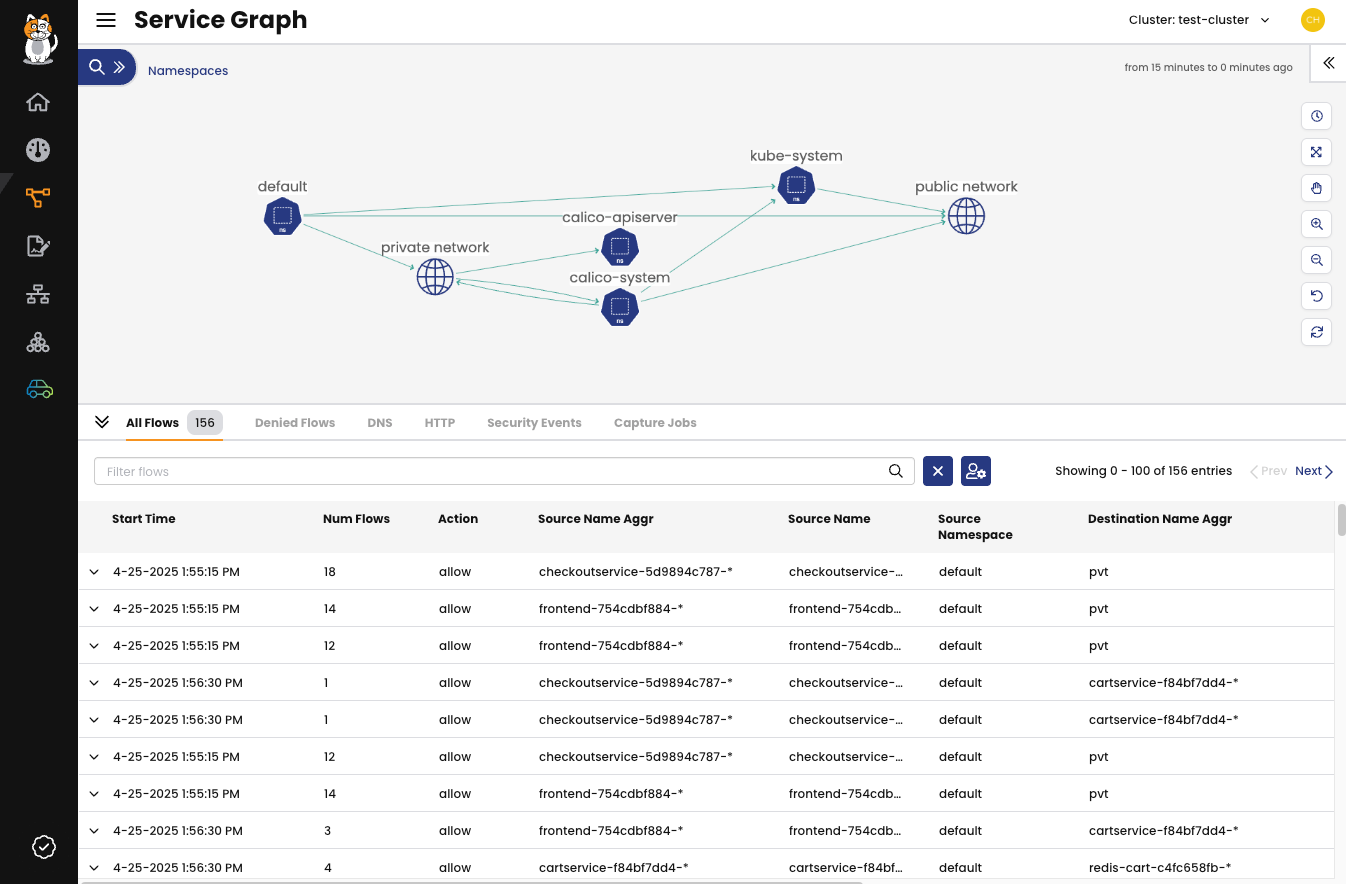
Figure 2: The Service Graph page.
Policies
Network policy is the primary tool for securing a Kubernetes network by controlling traffic flow. Policies restrict network traffic (egress and ingress) in your cluster so only the traffic that you explicitly allow can flow. Calico Cloud supports standard Kubernetes policies and its own enhanced network policies for fine-grained control.
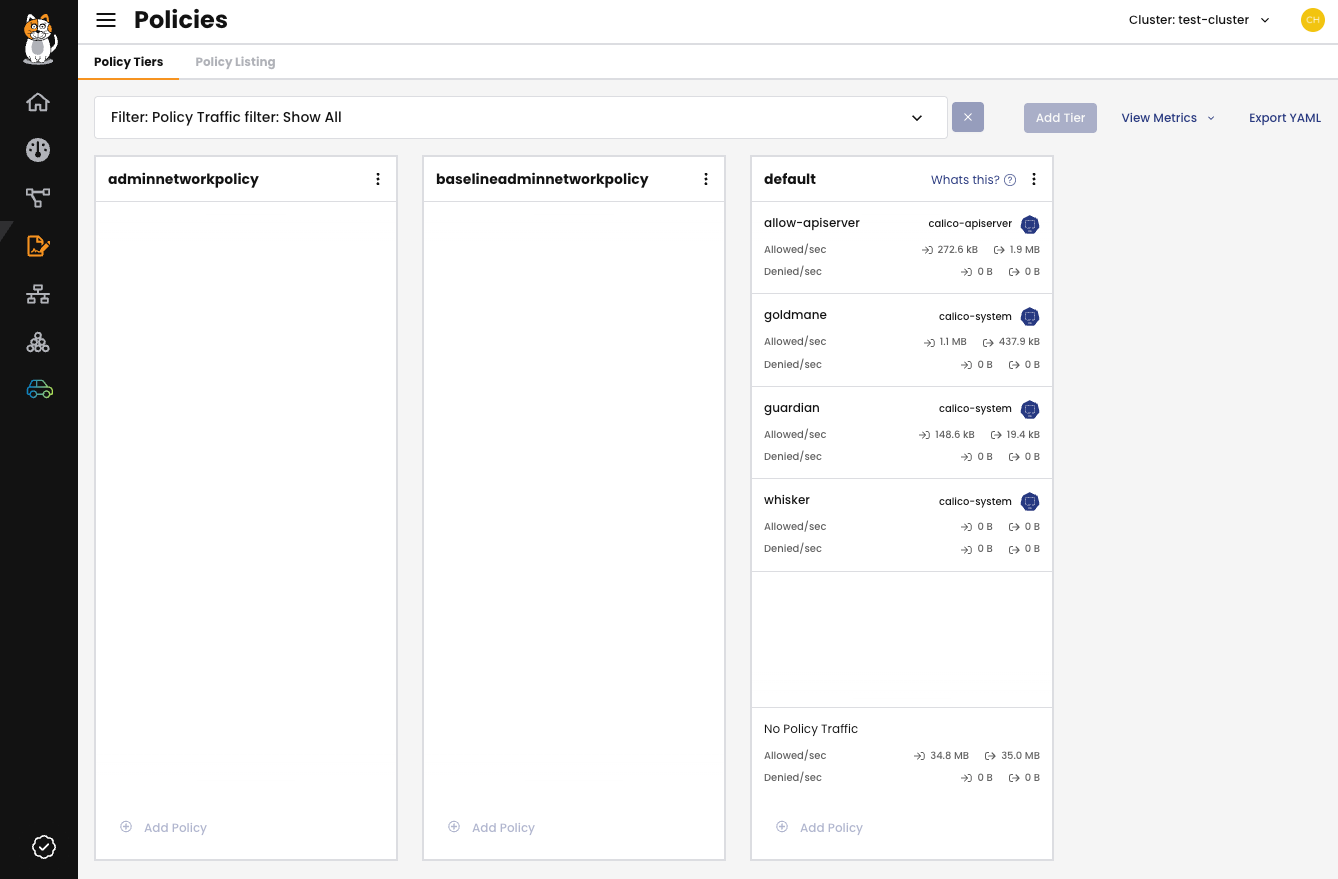
Figure 3: The Policies page.
For more information, see the Calico Open Source network policy documentation.
Policy recommendations
Policy recommendations help you secure your Kubernetes environments by automatically suggesting network policies based on observed network traffic. This proactively identifies necessary communication flows and enables you to implement a least-privilege security model with minimal effort. The recommendations are generated by analyzing flow logs. You can activate the recommendations as staged network policies for testing before you use them in production.
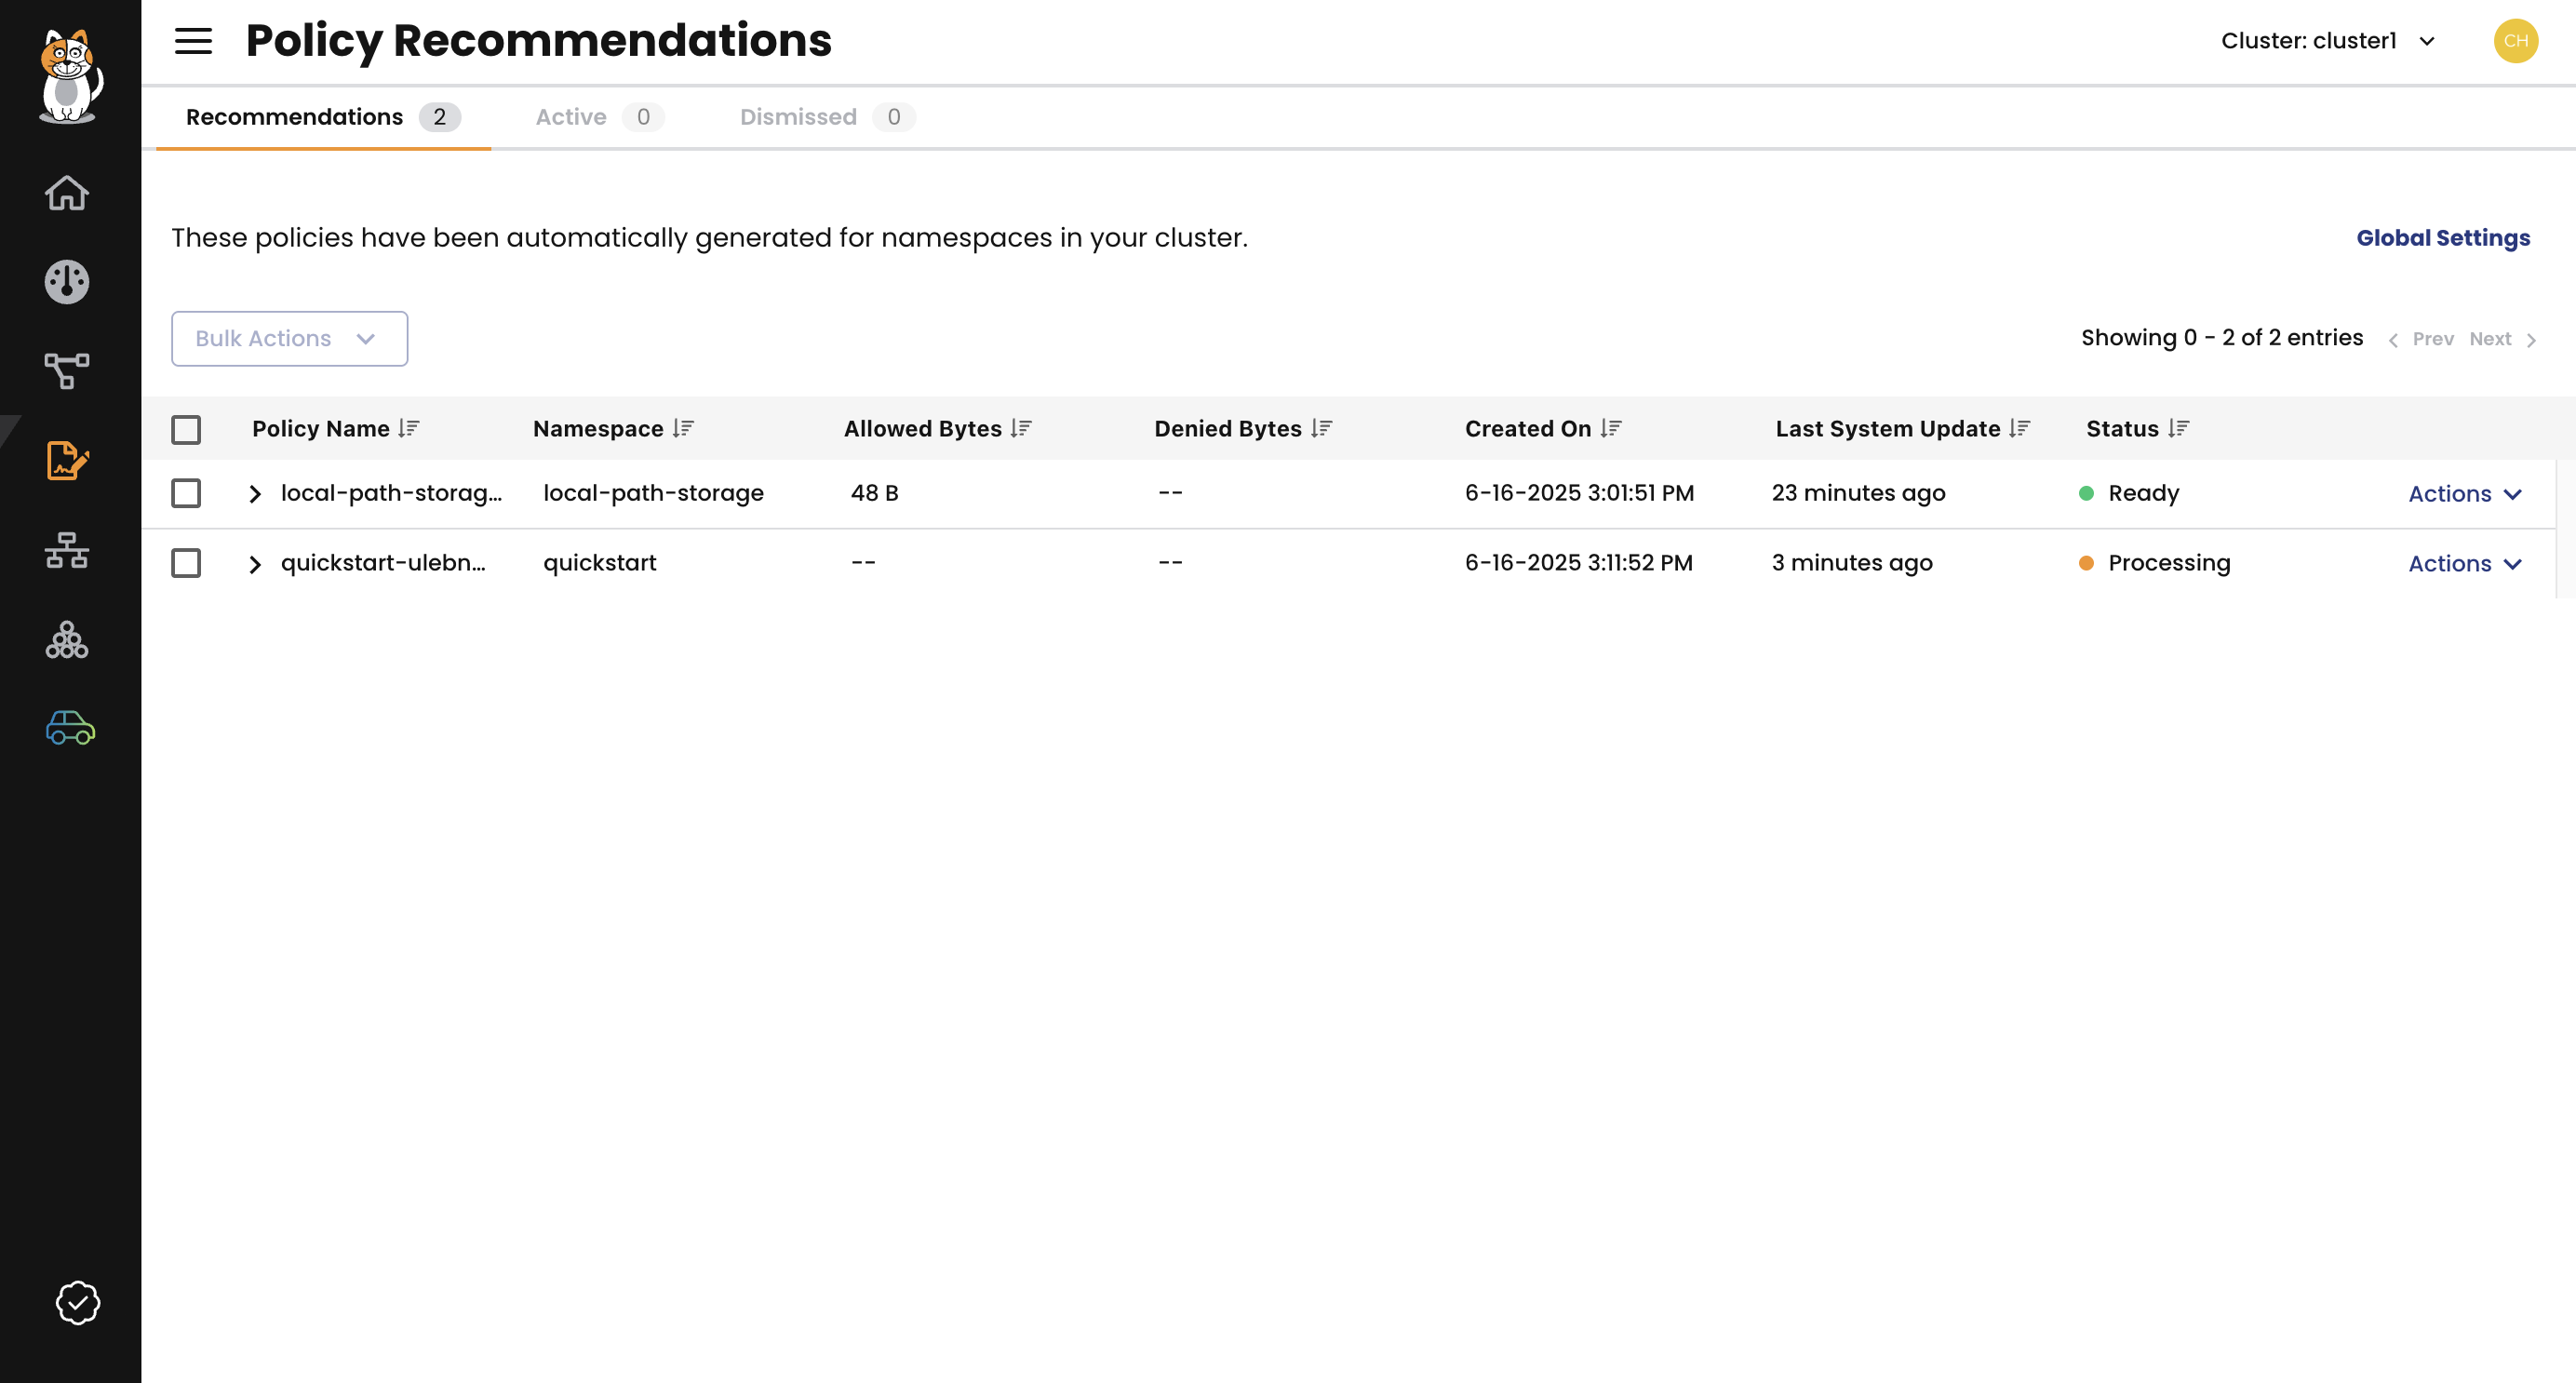
Figure 4: The Policy Recommendations page.
Network sets
Network sets are resources for defining IP subnetworks or CIDRs, which can then be easily referenced in network policies using standard label selectors. They are a powerful feature for simplifying policy management, especially when dealing with external network ranges or grouping common IP addresses. Using network sets makes policies more reusable and scalable.
For more information, see:
- Understanding network sets.
- Calico Open Source resource documentation on Network set and Global network set.
Next steps
- Sign up for a free account with Calico Cloud.
- Tutorial: Quickstart guide to Calico Cloud Free Tier.
- Connect a cluster to Calico Cloud Free Tier
- For an overview of the expanded feature set in Calico Cloud Pro, take a tour of the full web console.