Calico Cloud architecture
Calico Cloud security
Calico Cloud architecture is based on the Calico Cloud multi-cluster management feature. Calico Cloud manages the control plane, and you connect your clusters (called managed clusters) to the control plane. Communication between the Calico Cloud control plane and managed clusters is secured using TLS tunnels.

The components that secure communications between the Calico Cloud control plane and managed clusters are:
- Calico Cloud tunnel server - accepts secure TLS connections from managed clusters
- Guardian - an agent that runs in each managed cluster that proxies communication between Calico Cloud components and managed cluster components
All connections go through the Calico Cloud tunnel server and Guardian. The only exception is during installation and upgrade when managed clusters connect to Calico Cloud using TLS connections to get install/update resources, register the cluster, and report the status of the install/update.
The Calico Cloud tunnel is initiated by Guardian on the managed cluster. The Calico Cloud control plane does not initiate new connections to the managed cluster outside of the tunnel. However, there are connections that go through the Calico Cloud tunnel server that are initiated from the control plane; for example, when a user interacts with the web console, or when configuration needs to be pushed into the managed cluster.
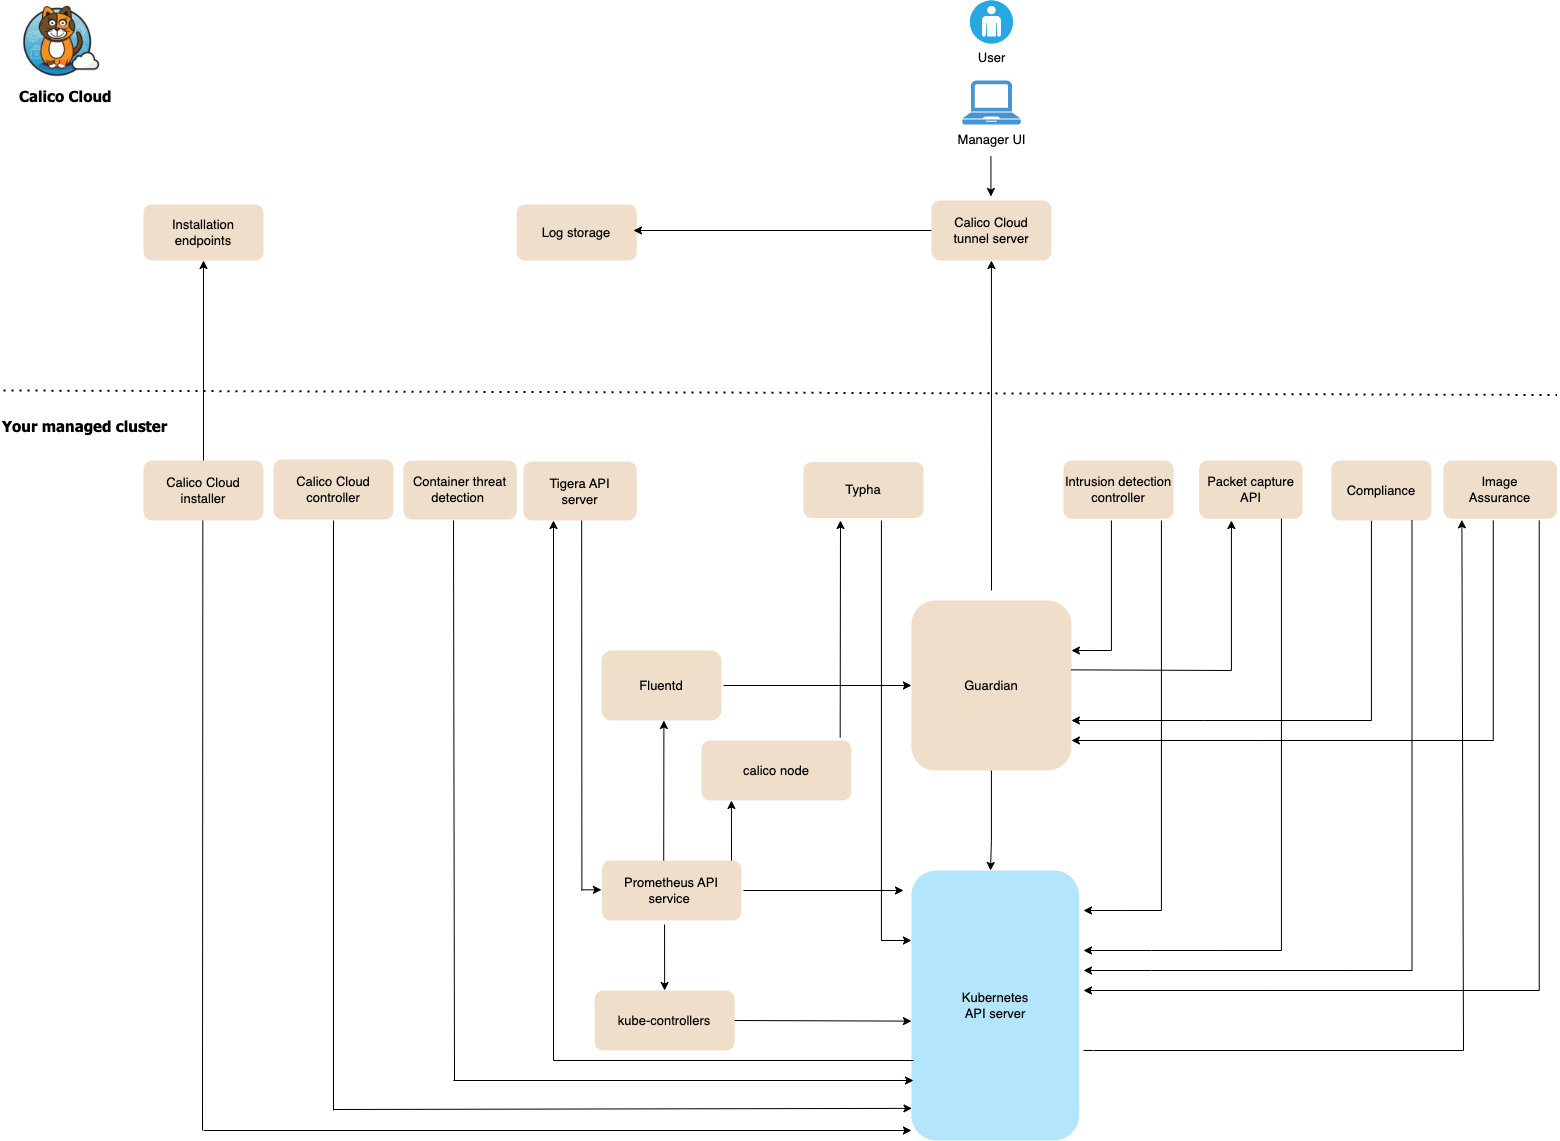
Managed cluster components
The following diagram shows the major components in a managed cluster, followed by component descriptions.
| Component | Description | Ports/Protocol |
|---|---|---|
| Calico Cloud controller | Deploys required resources for Calico Cloud. | TCP 6443 to Kubernetes API server |
| Calico Cloud installer | Gets installation resources from the Calico Cloud portal, registers a managed cluster, and reports installation or upgrade progress. | • TCP 443 to Calico Cloud hosted service • TCP 6443 to Kubernetes API server |
| Calico Cloud tunnel server | Communicates with managed clusters by creating secure TLS tunnels. | Port 9000 from managed clusters |
| calico-node | Bundles key components that are required for networking containers with Calico Cloud: • Felix • BIRD • confd | • TCP 5473 to Typha • TCP 9900 and 9081 from Prometheus API service |
| Container threat detection | A threat detection engine that analyzes observed file and process activity to detect known malicious and suspicious activity. Monitors the following types of suspicious activity within containers: • Access to sensitive system files and directories • Defense evasion • Discovery • Execution • Persistence • Privilege escalation Includes these components: Runtime Security Operator An operator to manage and reconcile container threat defense components. Runtime Reporter Pods Pods running on each node in the cluster to perform the detection activity outlined above.They send activity reports to Elasticsearch for analysis by Calico Cloud. | TCP to Kubernetes API server |
| Compliance | Generates compliance reports for the Kubernetes cluster. Reports are based on archived flow and audit logs for Calico Cloud resources, plus any audit logs you’ve configured for Kubernetes resources in the Kubernetes API server. Compliance reports provide the following high-level information: • Endpoints explicitly protected using ingress or egress policy • Policies and services - Policies and services associated with endpoints - Policy audit logs • Traffic - Allowed ingress/egress traffic to/from namespaces, and to/from the internet Compliance includes these components: compliance-snapshotter Handles listing of required Kubernetes and Calico Cloudconfiguration and pushes snapshots to Elasticsearch. Snapshots give you visibility into configuration changes, and how the cluster-wide configuration has evolved within a reporting interval. compliance-reporter Handles report generation. Reads configuration history from Elasticsearch and determines time evolution of cluster-wide configuration, including relationships between policies, endpoints, services, and network sets. Data is then passed through a zero-trust aggregator to determine the “worst-case outliers” in the reporting interval. compliance-controller Reads report configuration and manages creation, deletion, and monitoring of report generation jobs. compliance-benchmarker A daemonset that runs checks in the CIS Kubernetes Benchmark on each node so you can see if Kubernetes is securely deployed. | • TCP 8080 to Guardian • TCP 6443 to Kubernetes API server |
| Fluentd | Open-source data collector for unified logging. Collects and forwards Calico Cloud logs (flows, DNS, L7) to log storage. | • TCP 8080 to Guardian • TCP 9080 from Prometheus API service |
| Guardian | An agent running in each managed cluster that proxies communication between the Calico Cloud tunnel server and your managed cluster. Secured using TLS tunnels. | • Port 9000 to tunnel server • TCP 6443 to Kubernetes API server • TCP 6443 from Calico Cloud components |
| Installation endpoints | Endpoints at *.calicocloud.io and *.projectcalico.org. | TCP 443 for both |
| Intrusion detection controller | Handles integrations with threat intelligence feeds and Calico Cloud custom alerts. | • TCP 8080 to Guardian • TCP 6443 to Kubernetes API server |
| Image Assurance | Identifies vulnerabilities in container images that you deploy to Kubernetes clusters. Components of interest are: Admission controller Uses Kubernetes Validating Webhook Configuration to control which images can be used to create pods based on scan results. API Isolates tenant data and authorizes all external access to Image Assurance data. Note: Calico Cloud does not store registry credentials in its database and does not pull customer images into the Calico Cloud control plane. | • TCP 8080 to Guardian • TCP 6443 to Kubernetes API server |
| Kubernetes API server | A Kubernetes component that validates and configures data for the API objects (for example, pods, services, and others). | TCP 6443 (from all components) |
| kube-controllers | Monitors the Kubernetes API and performs actions based on cluster state. Calico Cloud kube-controllers container includes these controllers: • Node • Service • Federated services • Authorization | • TCP 9094 from Prometheus API service • TCP 6443 to Kubernetes API server |
| Log storage | Storage for logs (flows, L7, DNS, audit). Data for each managed cluster is isolated and protected against unauthorized access. | n/a |
| Packet capture API | Retrieves capture files (pcap format) generated by a packet capture for use with network protocol analysis tools like Wireshark. Packet capture data is visible in the web console and Service Graph. | • TCP 8449 Guardian to Packet Capture API • TCP 6443 to Kubernetes API server |
| Prometheus API service | Collects metrics from Calico Cloud components and makes the metrics available to the web console. | • TCP 6443 to Kubernetes API server • TCP 9080 to Fluentd • TCP 9900 and 9081 to Prometheus API service |
| Tigera API server | Allows users to manage Calico Cloud resources such as policies and tiers through kubectl or the Kubernetes API server. | • TCP 9095 to Prometheus API service • TCP 8080 from Kubernetes API server |
| Typha | Increases scale by reducing each node’s impact on the datastore. | TCP 5473 from calico-node to Typha |
| User access to the web console | Authenticated users can access the browser-based the web console, which provides network traffic visibility and troubleshooting, centralized multi-cluster management, threat-defense, container threat detection, policy lifecycle management, scan images for vulnerabilities, and compliance for multiple roles/stakeholders. | Port 443 to Calico Cloud tunnel server |