Recommended Prometheus metrics
Big picture
Monitor the Calico Cloud Typha, Felix, and policy component metrics to ensure optimal cluster operation.
Concepts
Calico Cloud Typha, Felix, and policy components are the most critical to monitor because they are responsible for ensuring networking and security functions are up-to-date and working as expected.
Typha
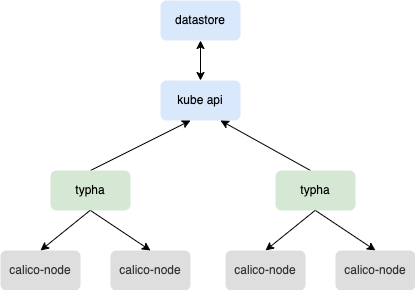
Typha is a caching datastore proxy that sits between calico-nodes and Kubernetes API Server. Its primary function is to allow for increased cluster scale by reducing the load on Kubernetes API Server. Without Typha, large clusters (200+ nodes) would need a considerable amount of memory to correspond to the continuous watches and requests from calico-nodes running in the cluster.
Typha maintains a single datastore connection on behalf of all of its clients (processes running in the calico-node pods, with Felix being Typhas’ main client). Typha watches for node, pod, network policy, bgp configuration, and other events on the Kubernetes API Server, caches and deduplicates this data, and fans out these events to its clients.
Felix
Felix is a component of calico-node and is responsible for Calico Cloud network policy.
Felix must be continuously in sync with the datastore to ensure the correct set of policies are applied to the node it is running on.
About metrics
Each Calico Cloud component that you want to connect to Prometheus for endpoint metrics has its own configuration (bgp, license, policy, felix, and typha).
Note that Felix is a separate application with metric endpoints, its own core metrics to monitor itself, and a separate port for a second policy metric endpoint.
Metrics
This section provides metrics recommendations for maintaining optimal cluster operations. Note the following:
- Threshold values for each metric depend on the cluster size and churn rate.
- Threshold recommendations are provided where possible, but because each cluster is different, and metrics can depend on cluster churn rate and scale. We recommend that you baseline the cluster to establish numbers that represent normal figures for your cluster.
- Metrics that start increasing rapidly from the baseline set need attention.
Typha
Felix
Typha general metrics
Datastore cache size
| Datastore cache size | |
|---|
| Metric | Note: Syncer (type) is Typha's internal name for a client (type).
Individual syncer values:
(typha_cache_size{syncer="bgp"})
(typha_cache_size{syncer="dpi"})
(typha_cache_size{syncer="felix"})
(typha_cache_size{syncer="node-status"})
(typha_cache_size{syncer="tunnel-ip-allocation"})
Sum of all syncers:
The sum of all cache sizes (each syncer type has a cache).
sum by (instance) (typha_cache_size)
Largest syncer:
max by (instance) (typha_cache_size) |
| Example value | Example of: max by (instance) (typha_cache_size{syncer="felix"})
{instance="10.0.1.20:9093"} 661
{instance="10.0.1.31:9093"} 661 |
| Explanation | The total number of key/value pairs in Typha's in-memory cache.This metric represents the scale of the Calico Cloud datastore as it tracks how many WEPs (pods and services), HEPs (hostendpoints), networksets, globalnetworksets, Calico Cloud Network Policies etc that Typha is aware of across the entire Calico Federation.You can use this metric to monitor individual syncers to Typha (like Felix, BGP etc), or to get a sum of all syncers. We recommend that you monitor the largest syncer but it is completely up to you. This is a good metric to understand how much data is in Typha. Note: If all Typhas are in sync then they should have the same value for this metric. |
| Threshold value recommendation | The value of this metric will depend on the scale of the Calico Federation and will always increase as WEPs, Calico Cloud network policies and clusters are added. Achieve a baseline first, then monitor for any unexpected increases from the baseline. |
| Threshold breach symptoms | Unexpected increases may indicate memory leaks and performance issues with Typha. |
| Threshold breach recommendations | Check CPU usage on Typha pods and Kubernetes nodes. Increase resources if needed, rollout and restart Typha(s) if needed. |
| Priority level | Optional. |
CPU usage
| CPU usage | |
|---|
| Metric | rate(process_cpu_seconds_total{30s}) * 100 |
| Example value | {endpoint="metrics-port", instance="10.0.1.20:9093", job="typha-metrics-svc", namespace="calico-system", pod="calico-typha-6c6cc9fcf7-csbdl", service="typha-metrics-svc"} 0.27999999999999403 |
| Explanation | CPU in use by Typha represented as a percentage of a core. |
| Threshold value recommendation | A spike at startup is normal. It is recommended to achieve a baseline first, then monitor for any unexpected increases from this baseline. A rule of thumb is to investigate maintained CPU usage above 90%. |
| Threshold breach symptoms | Unexpected maintained CPU usage could cause Typha to fall behind in updating its clients (for example, Felix) and could cause delays to policy updates. |
| Threshold breach recommendations | Check CPU usage on Kubernetes nodes. If needed, increase resources, and rollout restart Typha(s). |
| Priority level | Recommended. |
Memory usage
| Memory usage | |
|---|
| Metric | process_resident_memory_bytes |
| Example value | process_resident_memory_bytes{endpoint="metrics-port", instance="10.0.1.20:9093", job="typha-metrics-svc", namespace="calico-system", pod="calico-typha-6c6cc9fcf7-csbdl", service="typha-metrics-svc"} 80515072 |
| Explanation | Amount of memory used by Typha. |
| Threshold value recommendation | It is recommended to achieve a baseline first, then monitor for any unexpected increases from this baseline. A rule of thumb is to investigate if maintained memory usage is above 90% of what is available from the underlying node. The metric can also be used for memory leaks. In this case, the metric would show Typhas' memory consumption rising over time, even though the cluster is in a stable state. |
| Threshold breach symptoms | Unexpected maintained memory usage could cause Typha to fall behind in updating its clients (for example, Felix) and could cause delays to policy updates. |
| Threshold breach recommendations | Check memory usage on Kubernetes nodes. Increase resources if needed, and rollout restart Typha(s) if needed. |
| Priority level | Recommended. |
Typha cluster mesh metrics
The following metrics are applicable only if you have implemented Cluster mesh.
Note that this metric requires a count syntax because you will have a copy of the metric per RemoteClusterConfiguration. As shown in the table, the value 2 = In Sync reflects good connections.
remote_cluster_connection_status\{cluster="foo"\} = 2
remote_cluster_connection_status\{cluster="bar"\} = 2
remote_cluster_connection_status\{cluster="baz"\} = 1
Remote cluster connections (in-sync)
| Remote cluster connections (in-sync) | |
|---|
| Metric | count by (instance) (remote_cluster_connection_status == 2) |
| Explanation | This represents the number of remote cluster connections that are connected and in sync. Each remote cluster will report a connection_status value from the following list:
- 0 = Not Connected
- 1 = Connecting
- 2 = In Sync
- 3 = Resync in Process
- 4 = Config Change Restart Required
We suggest the count syntax because there will be one copy of remote_cluster_connection_status per cluster: - remote_cluster_connection_status[cluster="foo"] = 2
remote_cluster_connection_status[cluster="bar"] = 2
remote_cluster_connection_status[cluster="baz"] = '
Counting the number of metrics with value 2 returns the number of In Sync clusters. |
| Threshold value recommendation | When remote cluster connections are initializing, connection_status values will fluctuate. After the connection is established, this value should be equal to the number of remote clusters in the environment (if everything is in sync). |
| Threshold breach symptoms | N/A
For out-of-sync symptoms, see the out-of-sync metric. |
| Threshold breach recommendations | N/A
For out-of-sync recommendations, see the out-of-sync metric. |
| Priority level | Recommended. |
Remote cluster connections (out-of-sync)
The following metrics are applicable only if you have implemented Cluster mesh.
| Remote cluster connections (out-of-sync) | |
|---|
| Metric | count by (instance) (remote_cluster_connection_status != 2) |
| Explanation | Number of remote cluster connections that are not in sync (i.e. resyncing or failing to connect). Each remote cluster will report a connection_status value from the following list:
- 0 = Not Connected
- 1 = Connecting
- 2 = In Sync
- 3 = Resync in Process
- 4 = Config Change Restart Required |
| Threshold value recommendation | This value should be 2 if everything is in sync. Note: At Typha startup, it is normal to have non-2 values, but it should stabilize at 2 after connections come up. |
| Threshold breach symptoms | Typha will not receive updates from the relevant remote clusters. Connected clients will see stale or partial data from remote clusters. |
| Threshold breach recommendations | Investigate Typha's logs where remote cluster connectivity events are logged. Ensure the networking between clusters is not experiencing issues. |
| Priority level | Recommended. |
Typha client metrics
Total connections accepted
| Total connections accepted | |
|---|
| Metric | typha_connections_accepted |
| Example value | typha_connections_accepted{endpoint="metrics-port", instance="10.0.1.20:9093", job="typha-metrics-svc", namespace="calico-system", pod="calico-typha-6c6cc9fcf7-csbdl", service="typha-metrics-svc"} 10 |
| Explanation | Total number of connections accepted over time. This value always increases. |
| Threshold value recommendation | A steady increase over time is normal. Counters rising after a Felix or Typha restart is also normal (as clients get rebalanced). Investigate connection counters that rise rapidly with no Felix or Typha restarts. |
| Threshold breach symptoms | Counters rising when there are no Felix or Typha restarts, or no action that could cause restarts (an upgrade for example), could indicate unexpected Felix or Typha restarts or issues. |
| Threshold breach recommendations | Check resource usage on Typha(s) and Kubernetes nodes. Increase resources if needed. |
| Priority level | Optional. |
Client connections actively streaming
| Client connections actively streaming | |
|---|
| Metric | sum by (instance) (typha_connections_streaming) |
| Example value | {instance="10.0.1.20:9093"} 10
{instance="10.0.1.31:9093"} 5 |
| Explanation | Current number of active connections that are "streaming" (have completed the handshake), to this Typha. After a connection has been Accepted (reported in the previous metric), there will be a handshake before the connection is deemed to be actively streaming. This indicates how many clients are connected to a Typha. The sum reflects per-cache metrics as well. |
| Threshold value recommendation | Compare the value for Total Connections Accepted and Client Connections Actively Streaming. The fluctuation of these values should be in-sync with each other if Accepted Connections are turning into Actively Streamed connections. If there is a discrepancy , you should investigate. Note: As always, it is recommended to baseline the relationship between these two metrics to have a sense of what is normal. It is also worth noting that in smaller clusters, it is normal for Typha to be unbalanced. Typha can handle hundreds of connections so it is of no concern if all nodes in a 10-node cluster (for example) connect to the same Typha. |
| Threshold breach symptoms | Felix is not getting updates from Typha. Calico Cloud network policies are out-of-sync. |
| Threshold breach recommendations | Check Typha and Felix logs, and rollout restart Typha(s) if needed. |
| Priority level | Recommended. |
Rebalanced client connections
| Rebalanced client connections | |
|---|
| Metric | rate(typha_connections_dropped{$_rate_interval}) |
| Example value | {endpoint="metrics-port", instance="10.0.1.20:9093", job="typha-metrics-svc", namespace="calico-system", pod="calico-typha-6c6cc9fcf7-csbdl", service="typha-metrics-svc"} |
| Explanation | Number of client connections dropped to rebalance and share the load across different Typhas. |
| Threshold value recommendation | It is normal to see this value increasing sometimes. Investigate if connection dropped counters is rising constantly. If all Typhas are dropping connections because all Typhas believe they have too much load, this also warrants investigation. |
| Threshold breach symptoms | Dropping connections is rate limited so it should not affect the cluster as a whole. Typha clients, like Felix, will get dropped sometimes (but not constantly), and could result in periodic delays to policy updates. |
| Threshold breach recommendations | Ensure that the Kubernetes nodes have enough resources. |
| Priority level | Optional. |
99 percentile client fall-behind
| 99 percentile client fall-behind | |
|---|
| Metric | max by (instance) (typha_client_latency_secs{quantile='0.99'}) |
| Example value | {instance="10.0.1.20:9093"} 0.1234
{instance="10.0.1.31:9093"} 0.1234 |
| Explanation | This metric measures how far behind Typha's client-handling threads are at reading updates.This metric will increase if:
a) The client (e.g Felix) is slow or overloaded and cannot keep up with what Typha is sending or
b) Typha is overloaded and it cannot keep up with writes to all its clients.
This metric is a good indication of your cluster, Felix, and Typha health. |
| Threshold value recommendation | It is normal for this to spike when new clients connect; they must download and process the snapshot, during which time they will fall slightly behind. Investigate of latency persists. |
| Threshold breach symptoms | Typha clients receiving updates from Typha will be behind in time. Potential symptoms could include Calico Cloud network policies being out-of-sync. |
| Threshold breach recommendations | Check Typha and Felix logs and resource usage. It is recommended to focus on Felix logs and resource usage first, as there is generally more overhead with Felix and thus more of a chance of overload. Rollout restart Typha(s) and calico-node(s) if needed. |
| Priority level | Recommended. |
99 percentile client write latency
| 99 percentile client write latency | |
|---|
| Metric | max by (instance) (typha_client_write_latency_secs) |
| Example value | {instance="10.0.1.20:9093"} 0.007450815 |
| Explanation | Time for Typha to write to a client's socket (for example, Felix). |
| Threshold value recommendation | If the write latency is increasing, this indicates that a client (for example, Felix) is having an issue, or the network is having an issue. It is normal for intermittent spikes. Investigate any persistent latency. |
| Threshold breach symptoms | Typha clients will lag behind in receiving updates that Typha is sending. Potential symptoms include Calico Cloud network policies being out-of-sync. |
| Threshold breach recommendations | Check Felix logs and resource usage. |
| Priority level | Recommended. |
99 percentile client ping latency
| 99 percentile client ping latency | |
|---|
| Metric | max by (instance) (typha_ping_latency{quantile="0.99"}) |
| Example value | {instance="10.0.1.20:9093"} 0.034285331 |
| Explanation | This metric tracks the round-trip-time from Typha to a client. How long it takes for Typha's clients to respond to pings over the Typha protocol. |
| Threshold value recommendation | An increase in this metric above 1 second indicates that the clients, network or Typha are more heavily loaded. It is normal for intermittent spikes. Persistent latency above 1 second warrants investigation. |
| Threshold breach symptoms | Typha clients could be behind in time on updates Typha is sending. Potential symptoms include Calico Cloud network policies being out-of-sync. |
| Threshold breach recommendations | Check Typha and Felix logs and resource usage. It is recommended to focus on Felix logs and resource usage first, as there is generally more overhead with Felix and thus more of a chance of overload. Check if the node is overloaded and review/increase calico-node/Typha CPU requests if needed. If needed, rollout restart Typha(s) and calico-node(s). |
| Priority level | Recommended. |
Typha cache internals
99 percentile breadcrumb size
| 99 percentile breadcrumb size | |
|---|
| Metric | max by (instance) (typha_breadcrumb_size{quantile="0.99"}) |
| Explanation | Typha stores datastore changes as a series of blocks called breadcrumbs. Typha will store updates inside of these breadcrumbs (for example if a pod churned, this would be a single update). Typha can store multiple updates in a single breadcrumb with the default maximum size number being 100. |
| Threshold value recommendation | Typha generating blocks of size 100 during start up is normal. Investigate if Typha is consistently generating blocks of size 90+, which can indicate Typha is overloaded. |
| Threshold breach symptoms | Maintained block of sizes of 100 can indicate that Typha is falling behind on information and updates contained in the datastore. This will lead to Typha clients also falling behind (for example, Calico Cloud network policy object may not be current). |
| Threshold breach recommendations | Check Typha logs and resource usage. Check if there is a lot of activity within the cluster that would cause Typha to send large breadcrumbs (for example, a huge amount of pod churn). If possible, reduce churn rate of resources on the cluster. |
| Priority level | Recommended. |
Non-blocking breadcrumbs fraction
| Non-blocking breadcrumb fraction | |
|---|
| Metric | (sum by (instance) (rate(typha_breadcrumb_non_block{30s})))/((sum by (instance) (rate(typha_breadcrumb_non_block{30s})))+(sum by (instance) (rate(typha_breadcrumb_block{30s})))) |
| Example value | {instance="10.0.1.20:9093"} NaN |
| Explanation | Typha stores datastore changes as a series of blocks called "breadcrumbs". Each client "follows the breadcrumbs" either by blocking and waiting, or skipping to the next one (non-blocking) if it is already available. Non-blocking breadcrumb actions indicates that Typha is constantly sending breadcrumbs to keep up with the datastore. Blocking breadcrumb actions indicate that Typha and the client have caught up, are up-to-date, and are waiting on the next breadcrumb. This metric will give a ratio between blocking and non-blocking actions that can indicate the health of Typha, its clients, and the cluster. |
| Threshold value recommendation | As the load on Typha increases, the ratio of skip-ahead, non-blocking reads, increases. If it approaches 100% then Typha may be overloaded (since clients only do non-blocking reads when they're behind). |
| Threshold breach symptoms | Consistent non-blocking breadcrumbs could indicate that Typha is falling behind on information and updates contained in the datastore. This will lead to Typha clients also being behind (for example, Calico Cloud network policy object may not be current). |
| Threshold breach recommendations | Check Typha and Felix logs and resource usage. Check if there is a lot of activity within the cluster that would cause Typha to continuously send non-blocking breadcrumbs. |
| Priority level | Recommended. |
Datastore updates total
| Datastore updates total | |
|---|
| Metric | sum by (instance) (rate(typha_updates_total{30s})) |
| Example value | {instance="10.0.1.20:9093"} 0 |
| Explanation | The rate of updates from the datastore(s). For example, updates to Pods/Nodes/Policies/etc. |
| Threshold value recommendation | Intermittent spikes are expected. Constant updates indicates a very busy cluster (for example, lots of pod churn). |
| Threshold breach symptoms | Constant updates could lead to overloaded Typhas whereTyphas clients could fall behind. |
| Threshold breach recommendations | Ensure Typha has enough resources to handle a very dynamic cluster. |
| Priority level | Optional. |
Datastore update skipped (no-ops)
| Datastore update skipped (no-ops) | |
|---|
| Metric | sum by (instance) (rate(typha_updates_skipped{30s})) |
| Example value | {instance="10.0.1.20:9093"} 0 |
| Explanation | The number of updates from the datastore that Typha detected were no-ops. For example, an update to a Kubernetes node resource that did not touch any values that is of interest to Calico Cloud. Such updates are not propagated to clients, which saves resources. |
| Threshold value recommendation | N/A |
| Threshold breach symptoms | N/A |
| Threshold breach recommendations | N/A |
| Priority level | Optional. |
Typha snapshot details
Snapshot send time
| Median snapshot send time | |
|---|
| Metric | max by (instance) (typha_client_snapshot_send_secs{quantile="0.5"}) |
| Example value | {instance="10.0.1.20:9093"} NaN |
| Explanation | The median time to stream the initial datastore snapshot to each client. It is useful to know the time it takes for a client to receive the data when it connects; it does not include time to process the data. |
| Threshold value recommendation | Investigate if this value is moving towards 10s of seconds. |
| Threshold breach symptoms | High values of this metric could indicate that newly-started clients are taking a long time to get the latest snapshot of the datastore, increasing the window of time where networking/policy updates are not being applied to the data plane during a restart/upgrade. Typha has a write timeout for writing the snapshot; if a client cannot receive the snapshot within that timeout, it is disconnected. Clients falling behind on information and updates contained in the datastore (for example, Calico Cloud network policy object may not be current). |
| Threshold breach recommendations | Check Typha and calico-node logs and resource usage. Check for network congestion. Investigate why a particular calico-node is slow; it is likely on an overloaded node with insufficient CPU). |
| Priority level | Optional. |
Clients requiring grace period
| Clients requiring grace period | |
|---|
| Metric | sum by (instance) (typha_connections_grace_used) |
| Example value | {instance="10.0.1.20:9093"} 0 |
| Explanation | The number of Typhas with clients that required a grace period. After sending the snapshot to the client, Typha allows a grace period for the client to catch up to the most recent data. Typha sending the initial snapshot should take < 1 second, but the processing of the snapshot could take longer, so this grace period is there to allow the newly connected client to process the snapshot. |
| Threshold value recommendation | If this metric is constantly increasing, it can indicate potential performance issues with Typha and clients. It can indicate that performance is being impacted and may warrant investigation. |
| Threshold breach symptoms | High values of this metric could indicate clients falling behind on information and updates contained in the datastore (for example, Calico Cloud network policy object may not be current). |
| Threshold breach recommendations | Check Typha and calico-node logs and resource usage. Check for network congestion, and determine the root cause. |
| Priority level | Optional. |
Max snapshot size (raw)
| Max snapshot size (raw) | |
|---|
| Metric | max(typha_snapshot_raw_bytes) |
| Example value | {} 557359 |
| Explanation | The raw size in bytes of snapshots sent from Typha to clients. |
| Threshold value recommendation | N/A |
| Threshold breach symptoms | N/A |
| Threshold breach recommendations | N/A |
| Priority Level | Optional. |
Max snapshot size (compressed)
| Max snapshot size (compressed) | |
|---|
| Metric | max(typha_snapshot_compressed_bytes) |
| Example value | {}134845 |
| Explanation | The compressed size in bytes of snapshots sent from Typha to clients. |
| Threshold value recommendation | This metric can be helpful for customers to estimate the bandwidth requirements for Felix to startup. For example, if the compressed snapshot size is 20MB in size on average, and 1000 Felix/calico-nodes start up, the bandwidth requirements could be estimated at 20GB between the pool of Typha and the set of Felixes across the network. |
| Threshold breach symptoms | N/A |
| Threshold breach recommendations | N/A |
| Priority Level | Optional. |
Policy metrics
The following policy metrics are a separate endpoint exposed by Felix that are used in the web console. They require special Prometheus configuration to scrape the metrics. For details, see Policy metrics.
Denied traffic
| Denied traffic | |
|---|
| Metric | calico_denied_packets
calico_denied_bytes |
| Example value | calico_denied_packets{endpoint="calico-metrics-port", instance="ip-10-0-1-30.ca-central-1.compute.internal", job="calico-node-metrics", namespace="calico-system", pod="calico-node-6pcqm", policy="default |
| Explanation | Number of packets or bytes that have been dropped by explicit or implicit deny rules. Note that you'll get one instance of calico_denied_packets/bytes for each policy rule that is denying traffic. For example: calico_denied_packets{policy="tier1|fv/policy1|0|deny|-1",scrIP="10.245.13.133"} |
| Threshold value recommendation | The general rule of thumb is this metric should report zero at a stable state. Any deviation means that policy and traffic have diverged. Achieving a zero state depends on the stability and maturity of your cluster and policy. |
| Threshold breach symptoms | Either unexpected traffic is being denied because of an attack (one example), or expected traffic is being denied because of a misconfiguration in a policy. |
| Threshold breach recommendations | If this metric indicates that policy and traffic have diverged, the recommended steps are: Determine if an attack is causing the metric to spike, or if these flows should be allowed. If the flow should indeed be allowed, update the policy or a preceding policy to allow this traffic. |
| Priority level | Recommended. |
Traffic per rule
| Traffic per rule | |
|---|
| Metric | cnx_policy_rule_bytes
cnx_policy_rule_packets |
| Example value | cnx_policy_rule_bytes{action="allow", endpoint="calico-metrics-port", instance="ip-10-0-1-20.ca-central-1.compute.internal", job="calico-node-metrics", namespace="calico-system", pod="calico-node-qzpkt", policy="es-kube-controller-access", rule_direction="egress", rule_index="1", service="calico-node-metrics", tier="allow-tigera", traffic_direction="inbound"} |
| Explanation | Number of bytes or packets handled by Calico Cloud network policy rules. |
| Threshold value recommendation | This metric should usually be non-zero (unless expected). A zero value indicates the rule is not matching any packets, and could be surplus to requirements. |
| Threshold breach symptoms | N/A |
| Threshold breach recommendations | If this metrics consistently reports a zero value over an acceptable period of time, you can consider removing the policy rule. |
| Priority Level | Optional. |
Connections per policy rule
| Connections per policy rule | |
|---|
| Metric | cnx_policy_rule_connections |
| Example value | cnx_policy_rule_connections{endpoint="calico-metrics-port", instance="ip-10-0-1-20.ca-central-1.compute.internal", job="calico-node-metrics", namespace="calico-system", pod="calico-node-qzpkt", policy="es-kube-controller-access", rule_direction="egress", rule_index="0", service="calico-node-metrics", tier="allow-tigera", traffic_direction="outbound"} |
| Explanation | Number connections handled by Calico Cloud policy rules. |
| Threshold value recommendation | This metric is similar to Traffic per Rule but this deals more with flow monitoring. This metric should usually be non-zero. A zero value indicates that the rule is not matching any packets and could be surplus to requirements. |
| Threshold breach symptoms | N/A |
| Threshold breach recommendations | If this metrics consistently reports a zero value over an acceptable period of time, this policy rule can be considered for removal. |
| Priority Level | Optional. |
Felix cluster-state metrics
CPU usage
| CPU usage | |
|---|
| Metric | rate(process_cpu_seconds_total{30s}) * 100 |
| Example value | {endpoint="metrics-port", instance="10.0.1.20:9091", job="felix-metrics-svc", namespace="calico-system", pod="calico-node-qzpkt", service="felix-metrics-svc"}3.1197504199664072 |
| Explanation | CPU in use by calico-node represented as a percentage of a core. |
| Threshold value recommendation | A spike at startup is normal. It is recommended to first achieve a baseline and then monitor for any unexpected increases from this baseline. Investigate if maintained CPU usage goes above 90%. |
| Threshold breach symptoms | Unexpected maintained CPU usage could cause Felix to fall behind and could cause delays to policy updates. |
| Threshold breach recommendations | Check CPU usage on Kubernetes nodes. Increase resources if needed, rollout restart calico-node(s) if needed. |
| Priority level | Recommended. |
Memory usage
| Memory usage | |
|---|
| Metric | process_resident_memory_bytes |
| Example value | process_resident_memory_bytes{endpoint="metrics-port", instance="10.0.1.20:9091", job="felix-metrics-svc", namespace="calico-system", pod="calico-node-qzpkt", service="felix-metrics-svc"} 98996224 |
| Explanation | Amount of memory in use by calico-node. |
| Threshold value recommendation | Recommended to achieve a baseline first, then monitor for any unexpected increases from this baseline. Investigate if maintained CPU usage goes above 90% of what is available from the underlying node. |
| Threshold breach symptoms | Unexpected, maintained, memory usage could cause Felix to fall behind and could cause delays to policy updates. |
| Threshold breach recommendations | Check memory usage on Kubernetes nodes. Increase resources if needed, rollout restart typha(s) if needed. |
| Priority level | Recommended. |
Active hosts on each endpoint
| Active hosts on each endpoint | |
|---|
| Metric | felix_active_local_endpoints |
| Example value | felix_active_local_endpoints{endpoint="metrics-port", instance="10.0.1.30:9091", job="felix-metrics-svc", namespace="calico-system", pod="calico-node-6pcqm", service="felix-metrics-svc"} 36 |
| Explanation | Number of active pod-networked pods, and HEPs, on this node. |
| Threshold value recommendation | Threshold relates to resource limits on the node for example kubelet's max pods setting. |
| Threshold breach symptoms | Suggests Felix is getting out of sync. |
| Threshold breach recommendations | Rolling restart calico-node and report issue to support. |
| Priority level | Optional. |
Active calico nodes
| Active calico nodes | |
|---|
| Metric | max(felix_cluster_num_hosts) |
| Example value | {} 3 |
| Explanation | Total number of nodes in the cluster that have calico-node deployed and running. |
| Threshold value recommendation | This value should be equal to the number of nodes in the cluster. If there are discrepancies, then calico-nodes on some nodes are having issues. |
| Threshold breach symptoms | Calico Cloud network policies on affected nodes could be out-of-sync. |
| Threshold breach recommendations | Check calico-node logs, rollout restart calico-node if needed. |
| Priority level | Recommended. |
Felix cluster policies
| Felix cluster policies | |
|---|
| Metric | felix_cluster_num_policies |
| Example value | felix_cluster_num_policies{endpoint="metrics-port", instance="10.0.1.20:9091", job="felix-metrics-svc", namespace="calico-system", pod="calico-node-qzpkt", service="felix-metrics-svc"} 58 |
| Explanation | Total number of Calico Cloud network policies in the cluster. |
| Threshold value recommendation | Because Calico Cloud is a distributed system, the number of policies should be generally consistent across all nodes. It is expected to have some skew between nodes for a short period of time while they sync, however they should never be out of sync for very long. |
| Threshold breach symptoms | If nodes are out of sync for long time, calico-nodes may be having issues or experiencing resource contention. Check the Errors Plot to see if there are any iptables errors reported. |
| Threshold breach recommendations | Redeploy calico-node if issues are seen, and increase resources if needed. |
| Priority level | Optional. |
Felix active local policies
| Felix active local policies | |
|---|
| Metric | felix_active_local_policies |
| Example value | felix_active_local_policies{endpoint="metrics-port", instance="10.0.1.30:9091", job="felix-metrics-svc", namespace="calico-system", pod="calico-node-6pcqm", service="felix-metrics-svc"} 44 |
| Explanation | Total number of network policies deployed on per node basis. |
| Threshold value recommendation | There is no hard limit to active policies. We can handle 1000+ active policies, but it impacts performance, especially if there's pod churn. The best solution is to optimize policies by combining multiple rules into one policy, and make sure that top-level policy selectors are being used. |
| Threshold breach symptoms | N/A |
| Threshold breach recommendations | Redeploy calico-node if issues are seen, and increase resources if needed. |
| Priority level | Recommended. |
Felix open FDS
| Felix open FDS | |
|---|
| Metric | sum by (pod) (process_open_fds{pod=~"calico-node.*"}) |
| Example value | {pod="calico-node-6pcqm"} 90 |
| Explanation | Number of opened file descriptors per calico-node pod. |
| Threshold value recommendation | Alert on this metric when it approaches the ulimit (as reported in process_max_fds value). You should not be anywhere near the maximum. |
| Threshold breach symptoms | Felix may become unstable/crash or fail to apply updates as it should. These failures and issues are logged. |
| Threshold breach recommendations | Check Felix logs, redeploy calico-node if you see log issues, and increase max_fds value if possible. |
| Priority Level | Optional. |
Felix max FDS
| Felix max FDS | |
|---|
| Metric | sum by (pod) (process_max_fds{pod=~"calico-node.*"}) |
| Example value | {pod="calico-node-qzpkt"} 1048576 |
| Explanation | Maximum number of opened file descriptors allowed per calico-node pod. |
| Threshold value recommendation | N/A |
| Threshold breach symptoms | N/A |
| Threshold breach recommendations | N/A |
| Priority level | Optional. |
Felix resync started
| Felix resync started | |
|---|
| Metric | sum(rate(felix_resyncs_started{5m})) |
| Explanation | This is the number of times that Typha has reported to Felix that it is re-connecting with the datastore. |
| Threshold value recommendation | Occasional resyncs are normal. Investigate resync counters that rapidly rise. |
| Threshold breach symptoms | Typha pods may be having issues or experiencing resource contention. Some calico-nodes that are paired with Typha pods experiencing issues will not be able to sync with the datastore. |
| Threshold breach recommendations | Investigate the root cause to avoid redeploying Typha (which can be very disruptive). Check resource contention and network connectivity from Typha to the datastore to see if Typha is working fine or if the API server is overloaded. |
| Priority level | Recommended. |
Felix dropped logs
| Felix dropped logs | |
|---|
| Metric | felix_logs_dropped |
| Example value | felix_logs_dropped{endpoint="metrics-port", instance="10.0.1.20:9091", job="felix-metrics-svc", namespace="calico-system", pod="calico-node-qzpkt", service="felix-metrics-svc"} 0 |
| Explanation | The number of logs Felix has dropped. Note that this metric does not count flow-logs; it counts logs to stdout. |
| Threshold value recommendation | Occasional drops are normal. Investigate if drop counters rapidly rise. |
| Threshold breach symptoms | Felix will drop logs if it cannot keep up with writing them out. These are ordinary code logs, not flow logs. Calico-node may be under resource constraints. |
| Threshold breach recommendations | Check CPU usage on calico-nodes and Kubernetes nodes. Increase resources if needed, and rollout restart calico-node(s) if needed. |
| Priority level | Optional. |
Felix error metrics
IPset errors
| IPset errors | |
|---|
| Metric | sum(rate(felix_ipset_errors{5m})) |
| Example value | {} 0 |
| Explanation | Number of ipset creation, modification, and deletion command failures. This metric reports how many times the ipset command has failed when Felix tried to run it. An error can occur when Felix sends bad ipset command data, or the kernel throws an error (potentially because it was too busy to handle this request at that time). |
| Threshold value recommendation | Occasional errors are normal. Investigate error counters that rapidly rise. |
| Threshold breach symptoms | Calico Cloud network policies may not scope all endpoints in network policy rules. Cluster nodes may be under resource contention, which may result in other _error and _seconds metrics rising. Repeated errors could mean some persistent problem (for example, some other process has created an IP set with that name, which is incompatible). |
| Threshold breach recommendations | See the Errors Plot graph to determine if the scope is cluster-wide or node-local. Check calico-node logs. Check resource usage and contention on Kubernetes nodes and calico-nodes. Add nodes/resources if needed. If resource contention is not seen, restart calico-node(s) and monitor. Ensure that other process using IPtables are not blocking Calico Cloud network policy management. |
| Priority level | Optional. |
iptables restore errors
| iptables restore errors | |
|---|
| Metric | sum(rate(felix_iptables_restore_errors{5m})) |
| Explanation | The number of iptables-restore errors over five minutes. The iptables-restore command is used when Calico Cloud makes a change to iptables. For example, a new WEP or HEP is created, changes to a WEP or HEP or a change to a policy that affects a WEP or HEP. |
| Threshold value recommendation | Occasional errors are normal. Investigate error counters that rapidly rise. |
| Threshold breach symptoms | Calico Cloud network policies are not up to date. Cluster nodes may be under resource contention, which may result in other _error and _seconds metrics rising. |
| Threshold breach recommendations | See the Errors Plot graph to determine if the scope is cluster-wide or node-local. Check calico-node logs. Check resource usage and contention on Kubernetes nodes and calico-nodes. Add nodes/resources if needed. If no resource contention is seen, restart calico-node and monitor. |
| Priority level | Optional. |
iptables save errors
| iptables save errors | |
|---|
| Metric | sum(rate(felix_iptables_save_errors{5m})) |
| Example value | {} 0 |
| Explanation | Number of iptables-save errors. The iptables-save command is run before every iptables-restore command so that Calico Cloud has the current state of iptables. |
| Threshold value recommendation | Occasional errors are normal. Investigate error counters that rapidly rise. |
| Threshold breach symptoms | Calico Cloud network policies are not up to date. Cluster nodes may be under resource contention, which may result in other _error and _seconds metrics rising. Repeated errors could mean some persistent problem (for example, some other process has creating iptables rules that Calico Cloud cannot decode with the version of iptables-save in use). |
| Threshold breach recommendations | See the Errors Plot graph to determine if the scope is cluster-wide or node-local. Check calico-node logs. Check resource usage and contention on Kubernetes nodes and calico-nodes. Add nodes/resources if needed. If no resource contention is seen, restart calico-node and monitor. |
| Priority level | Optional. |
Felix log errors
| Felix log errors | |
|---|
| Metric | sum(rate(felix_log_errors{5m})) |
| Example value | {} 0 |
| Explanation | The number of times Felix fails to write out a log because the log buffer is full. |
| Threshold value recommendation | Occasional errors are normal. Investigate error counters that rapidly rise. |
| Threshold breach symptoms | Calico-node may be under resource contention, which may result in other _error and _seconds metrics rising. |
| Threshold breach recommendations | See the Errors Plot graph to determine if the scope is cluster-wide or node-local. Check resource usage and contention on Kubernetes nodes and calico-nodes. Add nodes/resources if needed. If no resource contention is seen, restart calico-node and monitor. |
| Priority level | Optional. |
Monitor Felix metrics using a graph
| Errors plot graph | |
|---|
| Metric | rate(felix_ipset_errors{5m}) || rate(felix_iptables_restore_errors[5m]) || rate(felix_iptables_save_errors[5m]) || rate(felix_log_errors{5m}) |
| Example value | {endpoint="metrics-port", instance="10.0.1.20:9091", job="felix-metrics-svc", namespace="calico-system", pod="calico-node-qzpkt", service="felix-metrics-svc"} 0 |
| Explanation | Checks if there have been any iptables-save, iptables-restore, or ipset command errors in the past five minutes. Keeps track of what node is reporting which error. |
| Threshold value recommendation | Occasional errors are normal. Investigate error counters that rapidly rise. For this specific metric it is worth focusing on the metric that is spiking, and referencing that metric information. |
| Threshold breach symptoms | Dependent on the specific metric that is logging errors. |
| Threshold breach recommendations | If more than one metric is rising, check if all rising metrics are related to a specific calico-node. If this is the case, then the issue is local to that calico-node. Check calico-node logs. Check resource usage for the node and calico-node pod. If more than one metric is rising rapidly across all calico-nodes, then it is a cluster-wide issue and cluster health must be checked. Check cluster resource usage, cluster networking/infrastructure health, and restart calico-nodes and calico-typha pods. |
| Priority level | Recommended. |
Felix time-based metrics
Data plane apply time quantile 0.5/0.9/0.99
| Data plane apply time quantile 0.5/0.9/0.99 | |
|---|
| Metric | felix_int_dataplane_apply_time_seconds{quantile="0.5"}
felix_int_dataplane_apply_time_seconds{quantile="0.9"}
felix_int_dataplane_apply_time_seconds{quantile="0.99"} |
| Example value | felix_int_dataplane_apply_time_seconds{quantile="0.5"}:felix_int_dataplane_apply_time_seconds{endpoint="metrics-port", instance="10.0.1.30:9091", job="felix-metrics-svc", namespace="calico-system", pod="calico-node-6pcqm", quantile="0.5", service="felix-metrics-svc"} 0.020859218 |
| Explanation | Time in seconds that it took to apply a data plane update ,viewed at the median, 90th percentile, and 99th percentile. |
| Threshold value recommendation | Thresholds will vary depending on cluster size and rate of churn. It is recommended that a baseline be set to determine a normal threshold value. In the field we have seen >10s in extremely high-scale clusters with 100k+ endpoints and lots of policy/Kubernetes services. |
| Threshold breach symptoms | Large time-to-apply values will cause a delay between Calico Cloud network policy commits and enforcement in the data plane. This is dependent on how Calico Cloud waiting for kube-proxy to release the iptables lock, which is influenced by the number of services in use. |
| Threshold breach recommendations | Increase cluster resources, and reduce the number of Kubernetes services if possible. |
| Priority level | Recommended. |
Felix route table list seconds quantile 0.5/0.9/0.99
| Felix route table list seconds quantile 0.5/0.9/0.99 | |
|---|
| Metric | felix_route_table_list_seconds{quantile="0.5"}
felix_route_table_list_seconds{quantile="0.9"}
felix_route_table_list_seconds{quantile="0.99"} |
| Example value | felix_route_table_list_seconds{quantile="0.5"}:felix_route_table_list_seconds{endpoint="metrics-port",instance="10.0.1.30:9091",job="felix-metrics-svc",namespace="calico-system", pod="calico-node-6pcqm",quantile="0.5", service="felix-metrics-svc"} 0.000860426 |
| Explanation | Time to list all the interfaces during a resync, viewed at the median, 90th percentile and 99th percentile. |
| Threshold value recommendation | Thresholds will vary depending on the number of cali interfaces per node. It is recommended that a baseline be set to determine a normal threshold value. |
| Threshold breach symptoms | High values indicate high CPU usage in felix and slow data plane updates. |
| Threshold breach recommendations | Increase cluster resources. Reduce the number of cali interfaces per node where possible. |
| Priority level | Optional. |
Felix graph update time quantile 0.5/0.9/0/99
| Felix graph update time seconds quantile 0.5/0.9/0.99 | |
|---|
| Metric | felix_calc_graph_update_time_seconds{quantile="0.5"}
felix_calc_graph_update_time_seconds{quantile="0.9"}
felix_calc_graph_update_time_seconds{quantile="0.99"} |
| Example value | felix_calc_graph_update_time_seconds{quantile="0.5"}:felix_calc_graph_update_time_seconds{endpoint="metrics-port",instance="10.0.1.30:9091", job="felix-metrics-svc",namespace="calico-system", pod="calico-node-6pcqm",quantile="0.5", service="felix-metrics-svc"} 0.00007129 |
| Explanation | This metric reports the time taken to update the calculation graph for each datastore on an update call, viewed at the median, 90th percentile and 99th percentile. The calculation graph is the Felix component that takes all the policies/workload endpoints/host endpoints information that it has received from Typha, and distills it down to data plane updates that are relevant for this node. |
| Threshold value recommendation | After start of day (where we will typically get a large update), then values should be sub 1 second (with occasional blips to 1+ seconds). Should be measured in milliseconds with the occasional blip to a second or two. Investigate if the result is constantly in values of seconds. |
| Threshold breach symptoms | High values indicate high CPU usage in felix and slow data plane updates. |
| Threshold breach recommendations | Increase cluster resources. Check calico-node logs. Rollout restart calico-node(s) if needed. |
| Priority level | Recommended. |