Kibana dashboards and logs
Kibana dashboards are deprecated and will be removed in an upcoming release. During the deprecation period, you will have read-only access to Kibana dashboards. You can still create custom dashboards using Calico Cloud's built-in dashboards.
Kibana
Kibana is the frontend for Calico Cloud Elasticsearch, which is the logging infrastructure that centrally stores logs from all managed clusters. Kibana provides an interface to explore Elasticsearch logs and gain insights into workload communication traffic volume, performance, and other key aspects of cluster operations. Log data is also summarized in custom dashboards.
The following logs are generated by Calico Cloud. All logs are enabled by default except l7 logs, which must be explicitly enabled.
| Log type | Description | Index in Kibana |
|---|---|---|
| flow | Layer 3/4 network flows for workloads: source and destination namespaces, pods, labels, and policies | tigera_secure_ee_flows* |
| l7 | Layer 7 network flows for workloads | tigera_secure_ee_l7* |
| audit | Audit logs for Calico Cloud resources | tigera_secure_ee_audit* |
| bgp | Calico Cloud networking BGP peering and route propagation. | tigera_secure_ee_bgp.* |
| dns | DNS lookups and responses from Calico Cloud domain-based policy. | tigera_secure_ee_dns* |
| events | Calico Cloud intrusion detection events: suspicious IPs, suspicious domains, and global alerts | tigera_secure_ee_events* |
Start Kibana and access dashboards
In the web console, from the left navbar select, Kibana. A new browser tab opens into Kibana.
In Kibana, click the hamburger icon in the top left corner, and select Analytics, Dashboard.
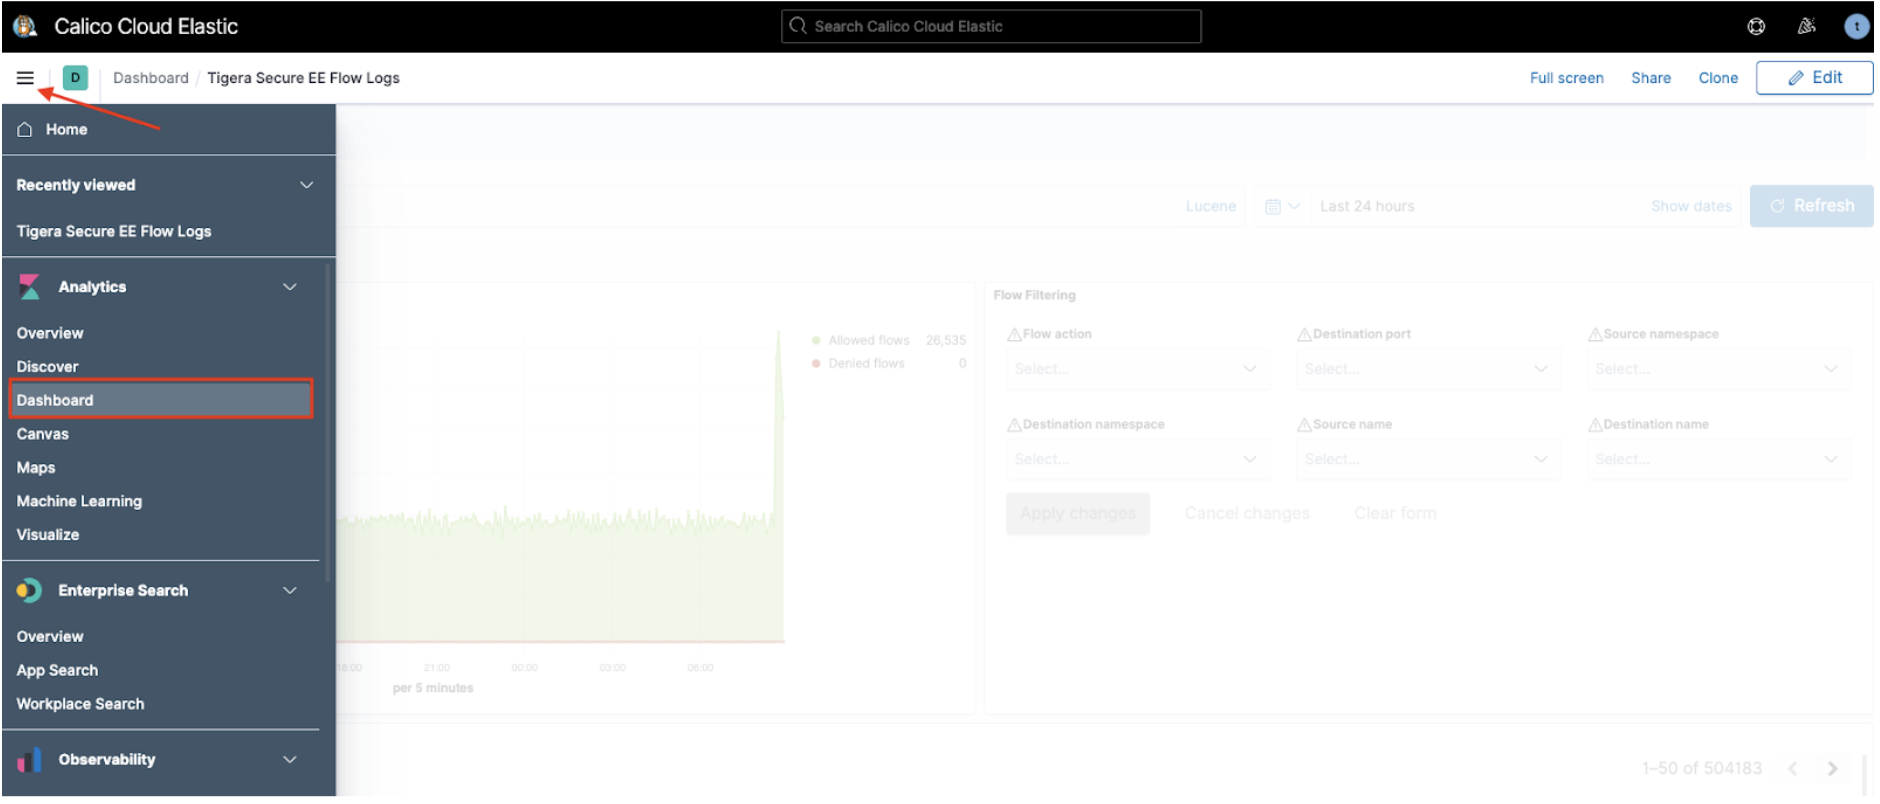
A list of curated dashboards is displayed. Note that some log types do not have a default dashboard (bgp and events).
DNS dashboard
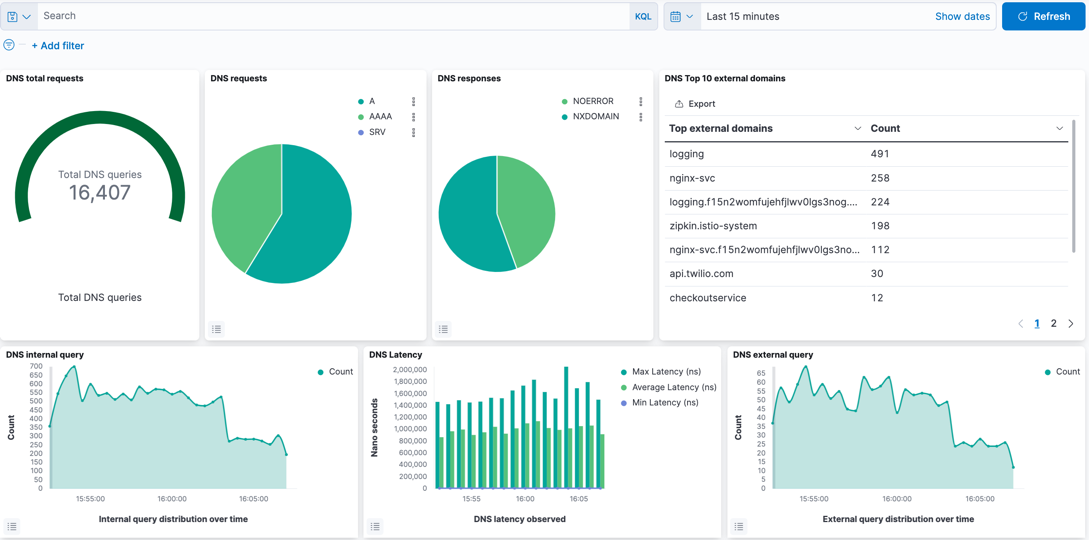
The DNS dashboard summarizes DNS data and logs into metrics, providing high-level information on the types of DNS lookups made, responses, and overall DNS performance. By default, DNS activity logs are captured only for requests/responses from Kubernetes built-in DNS services (CoreDNS). DNS activity to an external DNS server can be captured by configuring the parameter, dnsTrustedServers in Felix. DNS activity to Node local server is not supported.
The dashboard provides the following metrics/data, which can be edited as required.
| Metric/data | Description |
|---|---|
| DNS total requests | Cumulative DNS requests over the reporting period. Default: 24hrs. |
| DNS requests | Type of DNS request. |
| DNS responses | DNS response codes which may indicate issues with specific lookups. |
| DNS Top 10 external domains | Count of top domains in lookups. |
| DNS internal query | Lookups within the Kubernetes cluster. |
| DNS external query | Lookups to non-cluster domains. |
| DNS Latency | Measured latency which can indicate DNS issues. |
| DNS internal queries by service | Top types of requests within the cluster per service. |
| DNS external queries by service | Top types of requests external to the cluster per service. |
| DNS response code by service | Top DNS response codes per client. |
| DNS query count by server | Volume of DNS traffic per DNS server. |
| DNS transfer by service | Volume of DNS traffic per service. |
| DNS logs | Raw DNS logs. |
L7 HTTP dashboard
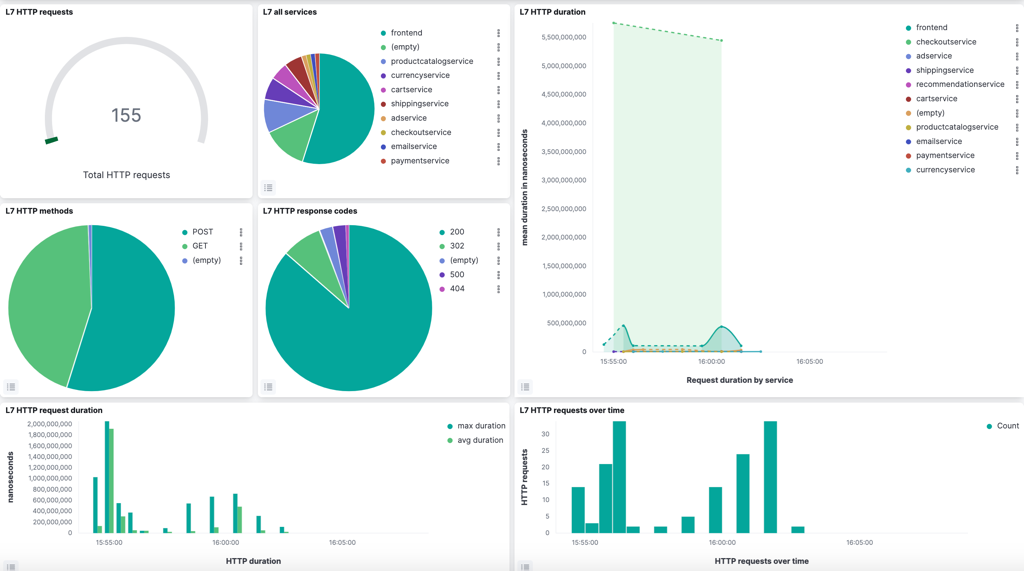
The L7 HTTP dashboard provides application performance metrics for in-scope Kubernetes services. The data can assist service owners and platform personnel in assessing the health of cluster workloads without the need for a full service mesh. L7 logs are not enabled by default, and must be configured.
The default metrics are:
- L7 HTTP requests
- L7 all services
- L7 HTTP duration
- L7 HTTP methods
- L7 HTTP response codes
- L7 HTTP request duration
- L7 HTTP requests over time
- L7 HTTP method by service
- L7 HTTP response by service
- L7 HTTP bytes transferred
- L7 Top URLs
- L7-search (raw HTTP logs)
Tigera Secure EE audit logs dashboard
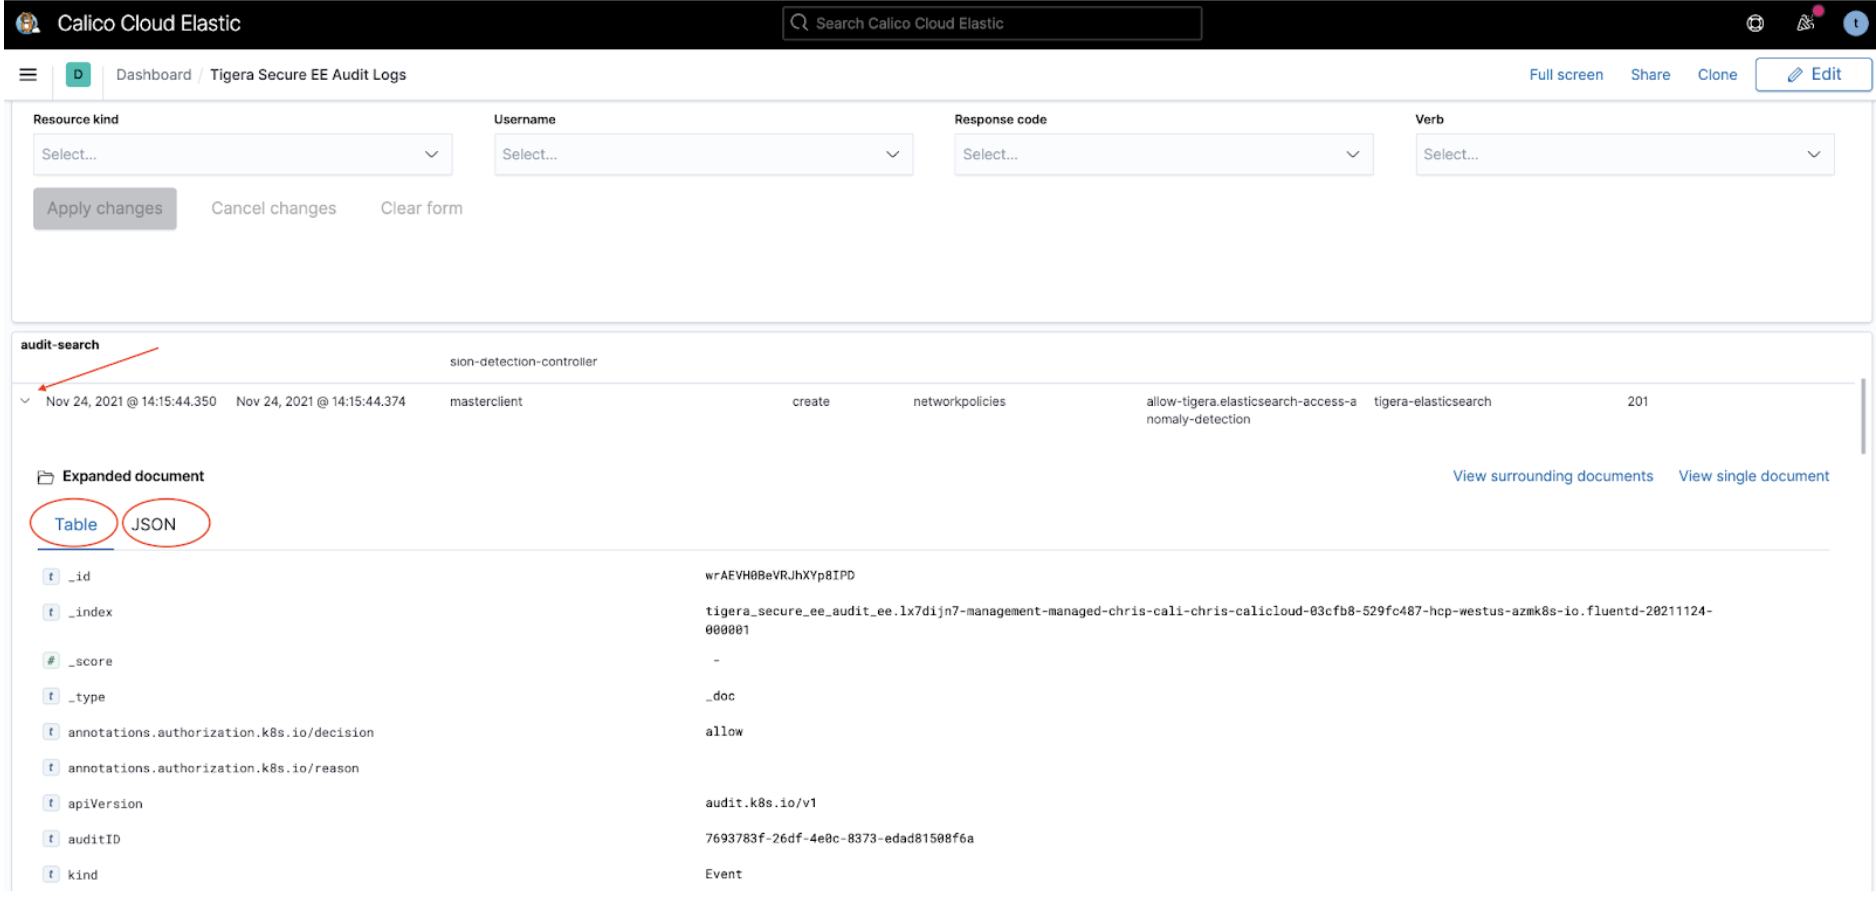
The Tigera Secure EE audit logs dashboard provides historical events of changes made to your deployment. These events can be used to understand updates to resources, privileged access and actions, and can also help demonstrate compliance for different regulatory concerns.
Audit logs listed in the section, audit-search can be expanded by clicking on the triangular expand icon, which presents the log in Table format by default. Clicking on JSON in the Expanded document displays the same log in JSON format. The logs can be filtered in the Audit Filtering Controls.
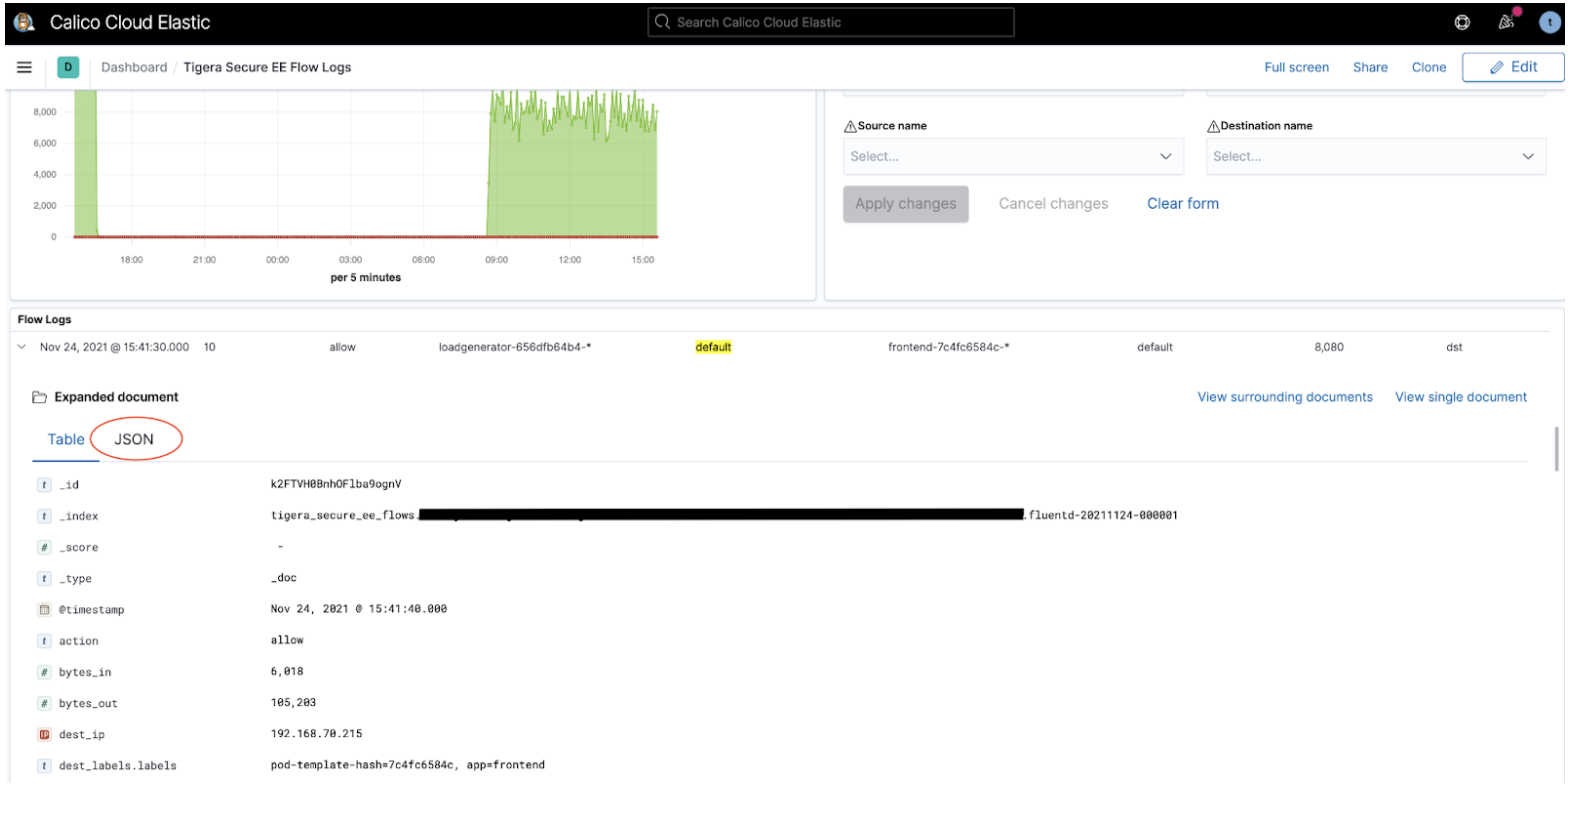
Tigera Secure EE flow logs dashboard
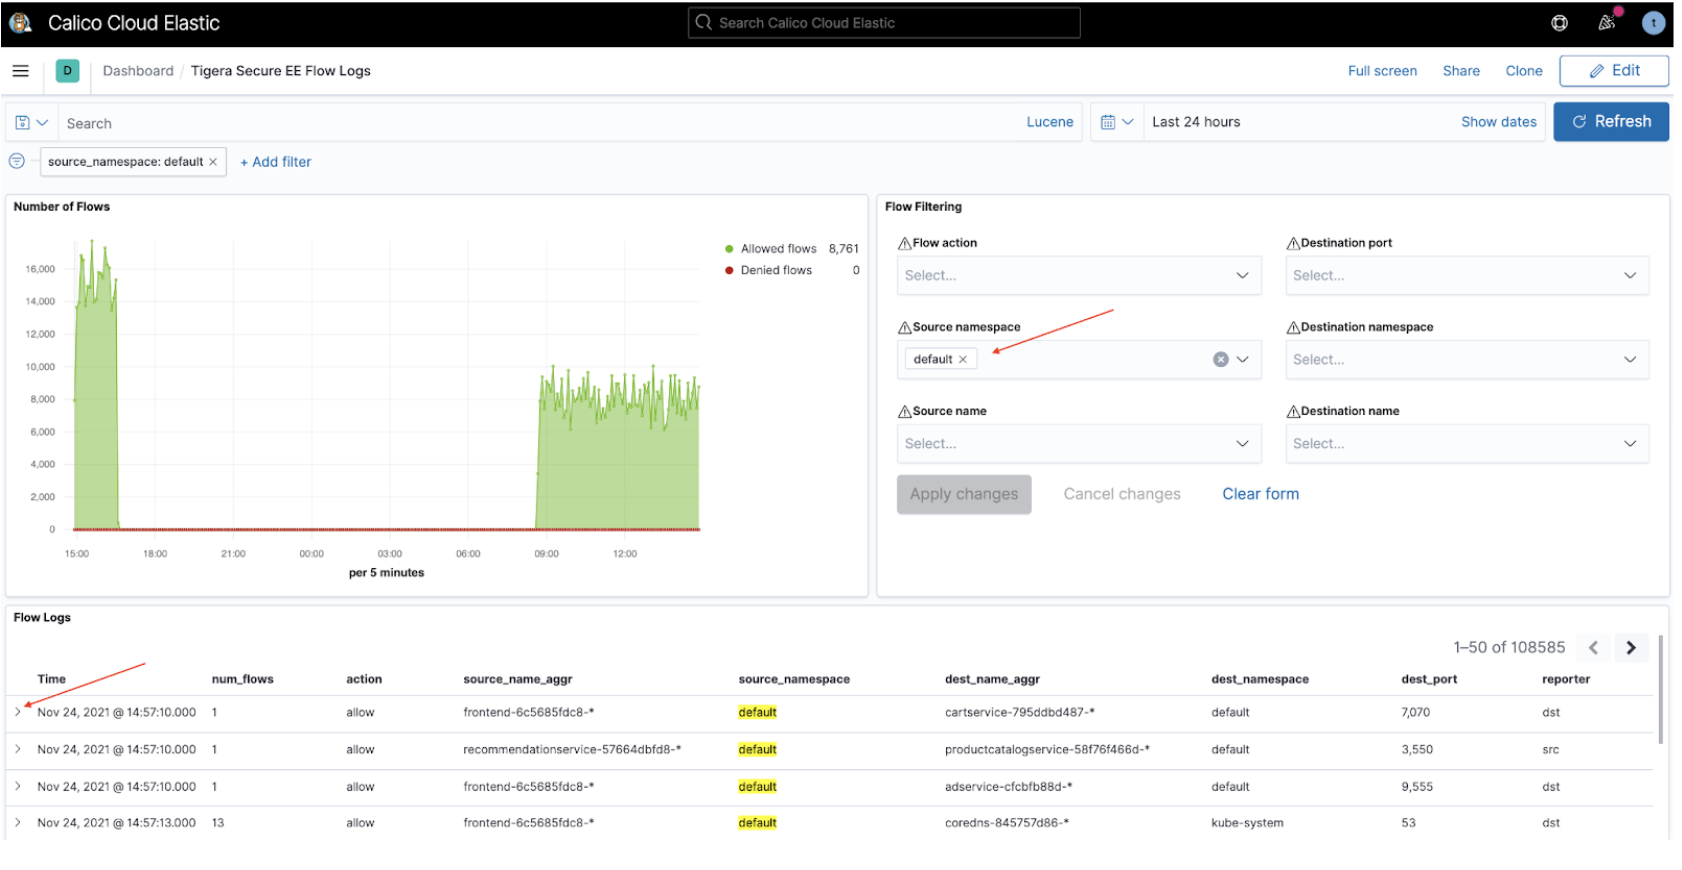
The Tigera Secure EE flow Logs dashboard lets you analyze flow logs using the filter options in the Flow Filtering window. The flow logs matching the applied filter are displayed below in the flow logs window. To review a specific flow log in detail, click the triangular expand icon to the left of the flow.
The full flow log is now displayed in Tabular format by default. To view the log in JSON format click the JSON header.
Tigera Secure EE Tor-VPN logs
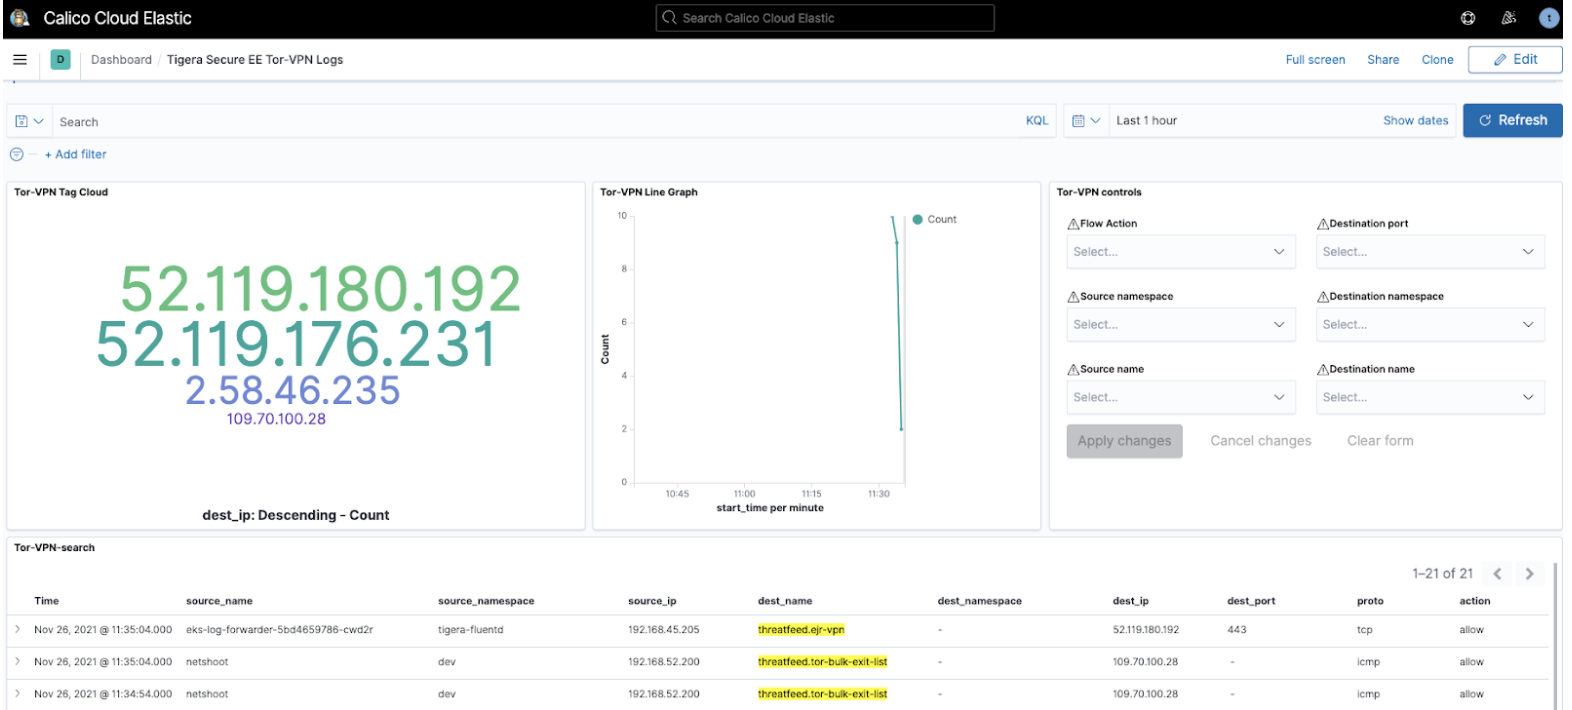
Tor and VPN-based traffic indicate the use of anonymization techniques in an attempt to mask the origins and destination of network traffic. Calico Cloud has built-in capabilities to assist with detecting such traffic and requires minimal configuration to activate.
Once enabled, the Tigera Secure EE Tor-VPN logs dashboard can provide a view into any traffic to/from Tor and VPN gateways. The information quickly provides InfoSec teams and operators a focused view on anonymization-based traffic patterns. The reported flows can be filtered in the Tor-VPN controls window and the flow logs for in-scope traffic can be reviewed in the Tor-VPN-search window.
Create custom filters and queries
Each dashboard has advanced filtering options if pre-built dashboards are insufficient. For example:
-
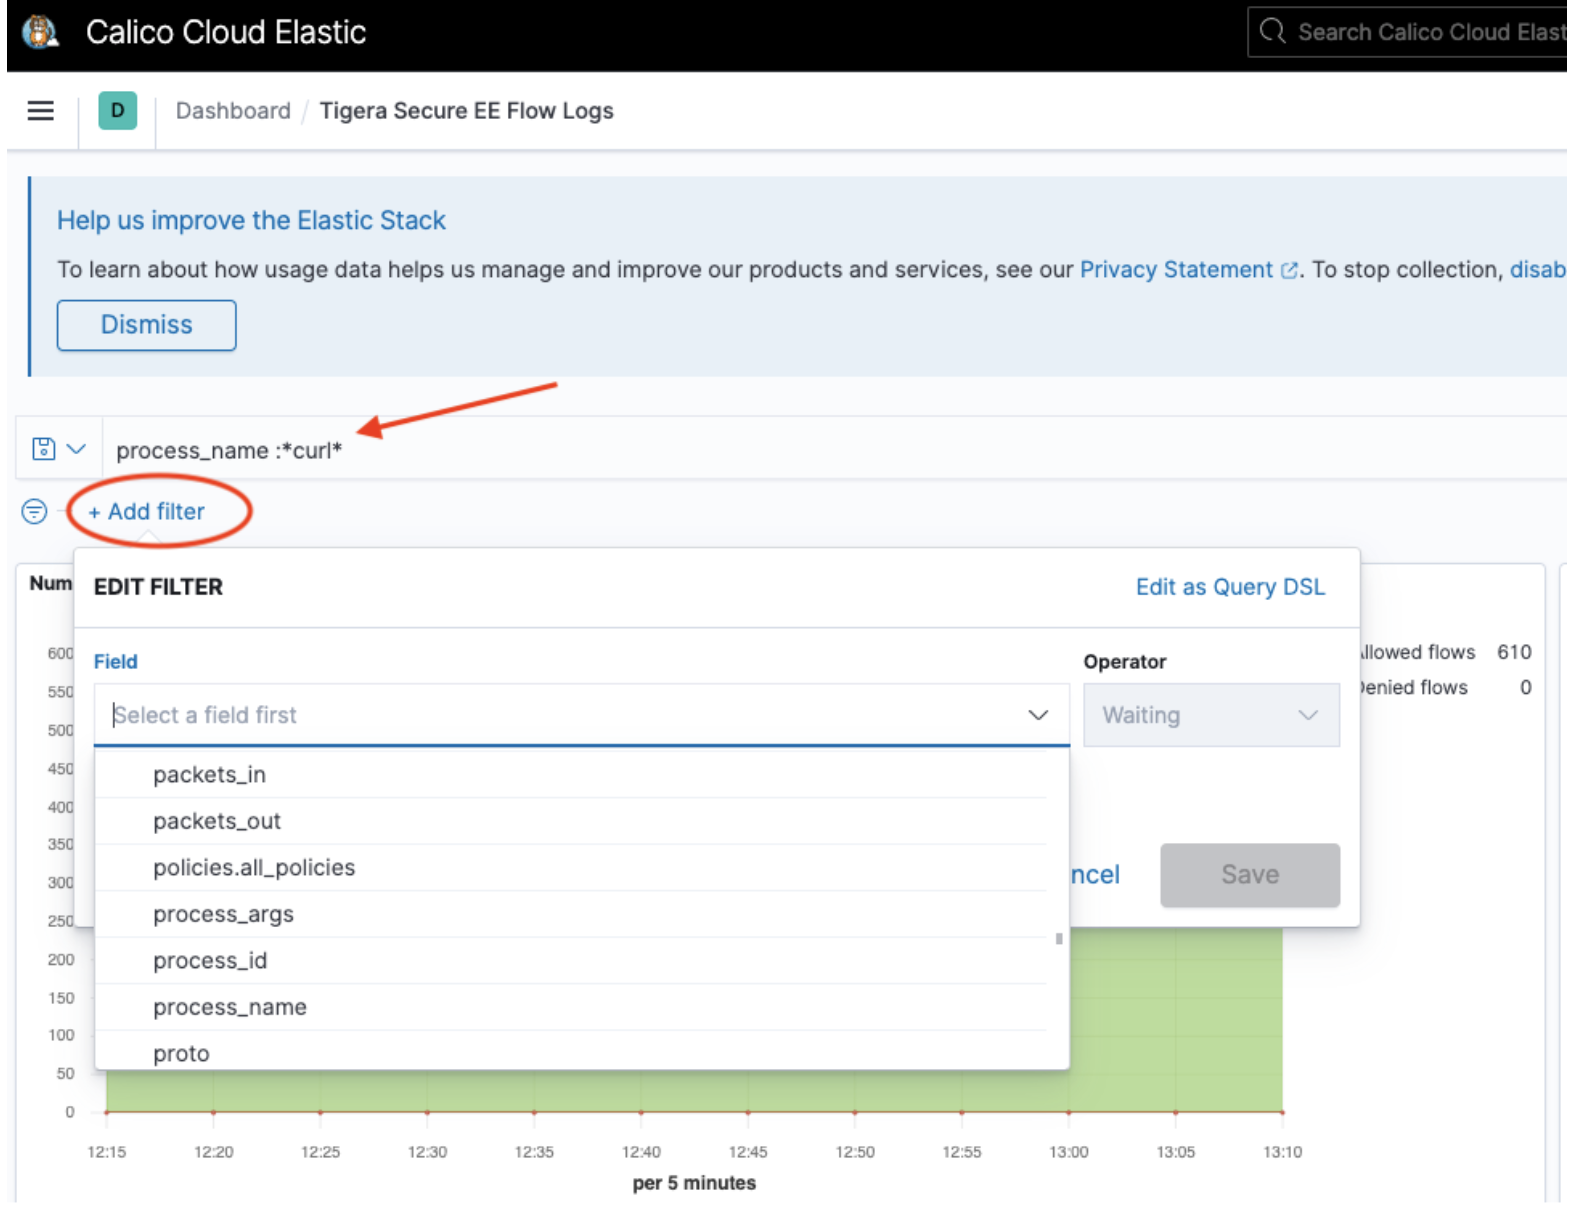
To build a query from all fields available in the logs, click Add Filter
-
To create a manual query, click Search (next to the disk icon on the left). The following example shows a query
process_name :*curl*for theprocess_name fieldmatching glob pattern, curl. Only logs wherefield process_namecontains the stringcurlare filtered.
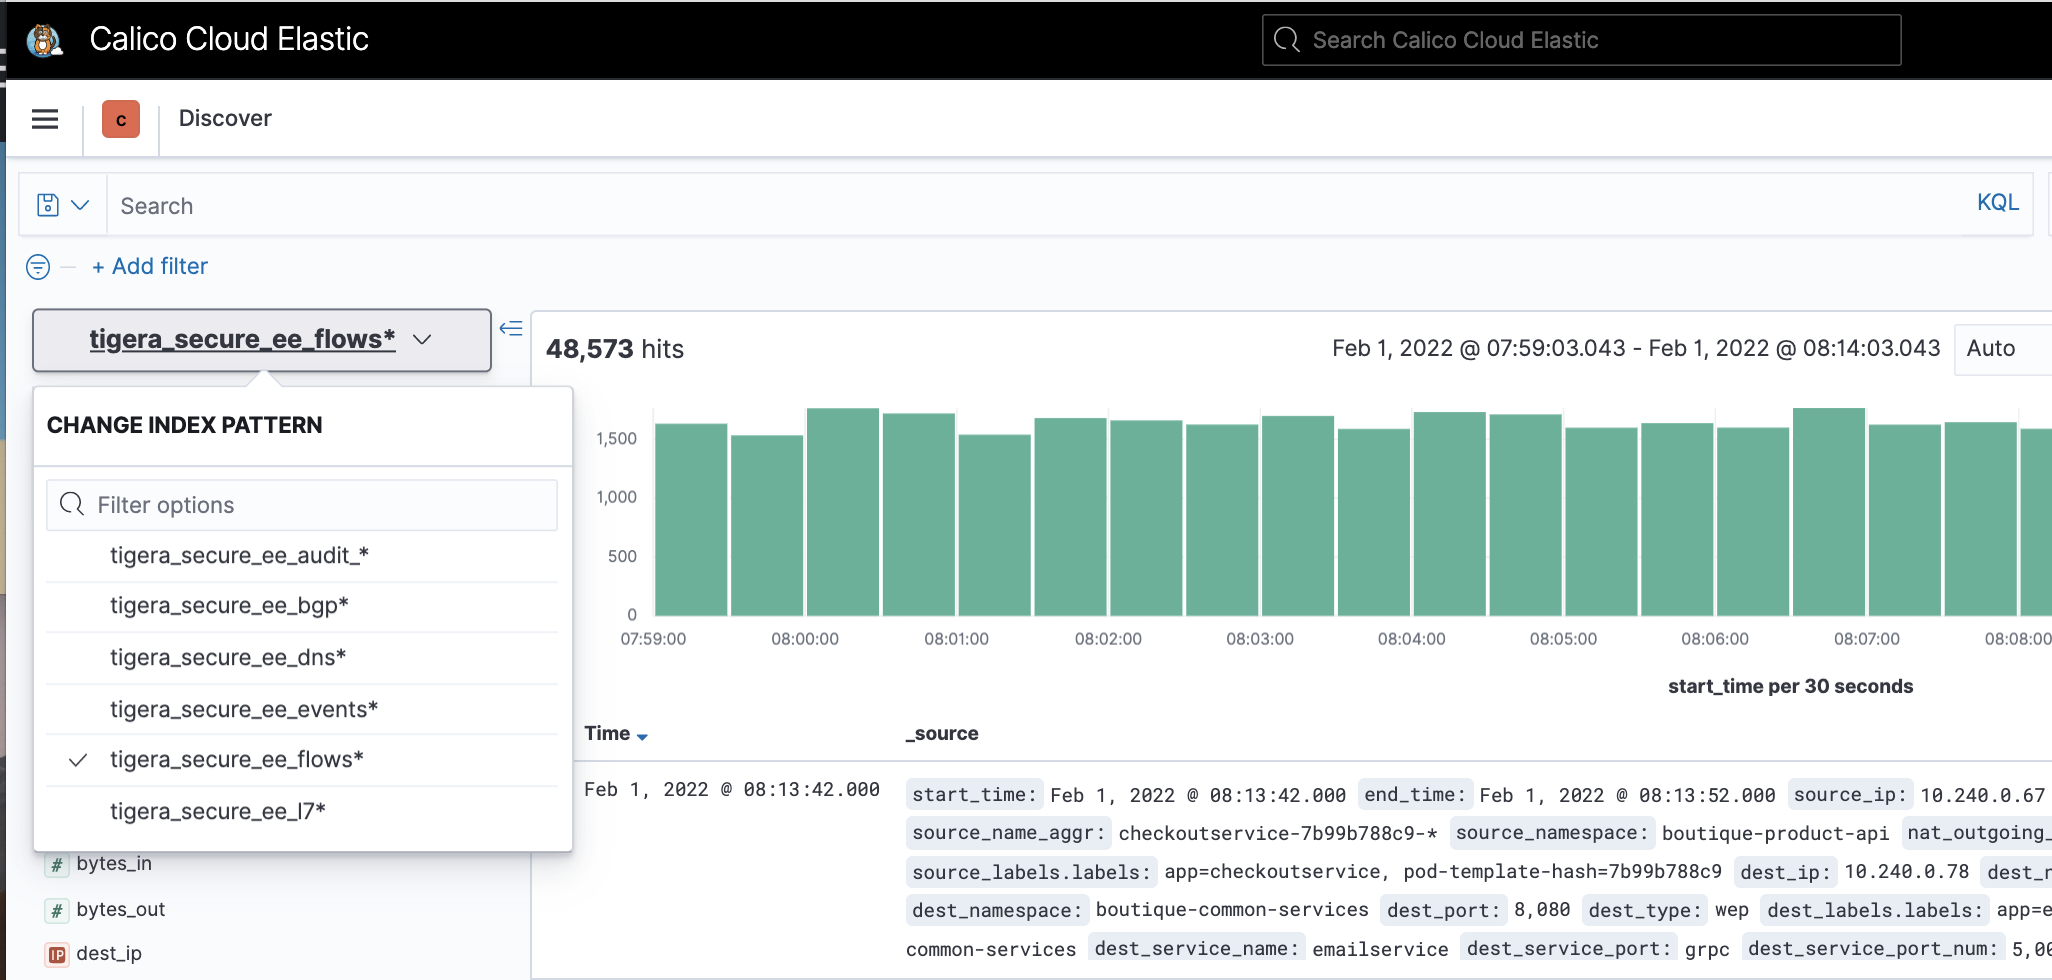
View logs by indices
To view logs by indices, click the hamburger menu, select Analytics, and click Discover.