Schedule and run compliance reports
The compliance features described on this page are deprecated and will be removed in a future release.
Big picture
Schedule and run compliance reports to assess Kubernetes workloads and environments for regulatory compliance.
Value
Compliance tools that rely on periodic snapshots, do not provide accurate assessments of Kubernetes workloads against your compliance standards. Calico Enterprise compliance dashboard and reports provide a complete inventory of regulated workloads, along with evidence of enforcement of network controls for these workloads. Additionally, audit reports are available to see changes to any network security controls.
Concepts
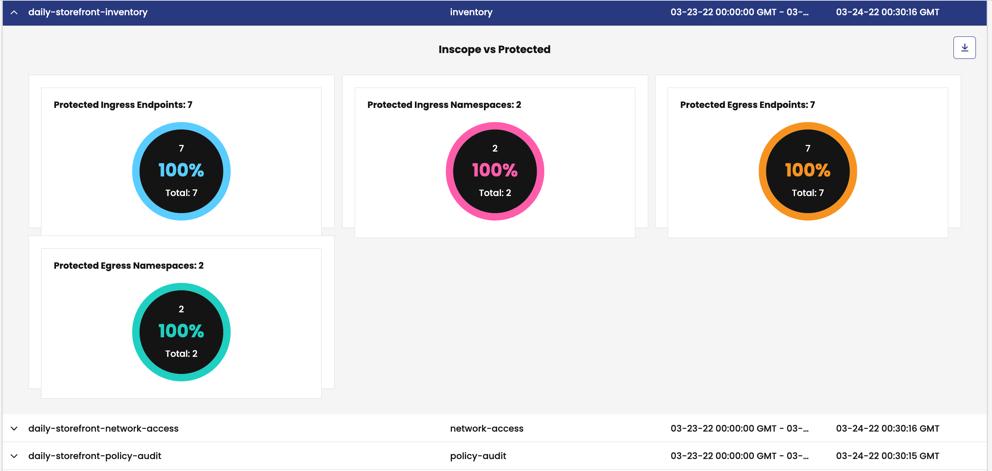
Compliance reports at a glance
Compliance report are based on archived flow logs and audit logs for all of your Calico Enterprise resources, plus any audit logs you've configured for Kubernetes resources in the Kubernetes API server:
- Pods
- Host endpoints
- Service accounts
- Namespaces
- Kubernetes service endpoints
- Global network sets
- Calico and Kubernetes network policies
- Global network policies
Compliance reports provide the following high-level information:
-
Protection
- Endpoints explicitly protected using ingress or egress policy
- Endpoints with Envoy enabled
-
Policies and services
- Policies and services associated with endpoints
- Policy audit logs
-
Traffic
- Allowed ingress/egress traffic to/from namespaces
- Allowed ingress/egress traffic to/from the internet
Before you begin
Unsupported
- AKS
- GKE
- OpenShift
- TKG
Required
-
Ensure that all nodes in your Kubernetes clusters are time-synchronized using NTP or similar (for accurate audit log timestamps)
-
Configure audit logs for Kubernetes resources
You must configure audit logs for Kubernetes resources through the Kubernetes API to get a complete view of all resources.
How to
- Configure report permissions
- Configure and schedule reports
- View report generation status
- Run reports
Configure report permissions
Report permissions are granted using the standard Kubernetes RBAC based on ClusterRole and ClusterRoleBindings. The following table outlines the required RBAC verbs for each resource type for a specific user actions.
| Action | globalreporttypes | globalreports | globalreports/status |
|---|---|---|---|
| Manage reports (create/modify/delete) | * | get | |
| View status of report generation through kubectl | get | get | |
| List the generated reports and summary status in the UI | list + get (for required reports) | ||
| Export the generated reports from the UI | get (for the particular report) | get (for required reports) |
The following sample manifest creates RBAC for three users: Paul, Candice and David.
- Paul has permissions to create/modify/delete the report schedules and configuration, but does not have permission to export generated reports from the UI.
- Candice has permissions to list and export generated reports from the UI, but cannot modify the report schedule or configuration.
- David has permissions to list and export generated
dev-inventoryreports from the UI, but cannot list or download other reports, nor modify the report schedule or configuration.
kind: ClusterRole
apiVersion: rbac.authorization.k8s.io/v1
metadata:
  name: tigera-compliance-manage-report-config
rules:
  - apiGroups: ['projectcalico.org']
    resources: ['globalreports']
    verbs: ['*']
  - apiGroups: ['projectcalico.org']
    resources: ['globalreports/status']
    verbs: ['get', 'list', 'watch']

---
kind: ClusterRoleBinding
apiVersion: rbac.authorization.k8s.io/v1
metadata:
  name: tigera-compliance-manage-report-config
subjects:
  - kind: User
    name: paul
    apiGroup: rbac.authorization.k8s.io
roleRef:
  kind: ClusterRole
  name: tigera-compliance-manage-report-config
  apiGroup: rbac.authorization.k8s.io

---
kind: ClusterRole
apiVersion: rbac.authorization.k8s.io/v1
metadata:
  name: tigera-compliance-list-download-all-reports
rules:
  - apiGroups: ['projectcalico.org']
    resources: ['globalreports']
    verbs: ['get', 'list']
  - apiGroups: ['projectcalico.org']
    resources: ['globalreporttypes']
    verbs: ['get']

---
kind: ClusterRoleBinding
apiVersion: rbac.authorization.k8s.io/v1
metadata:
  name: tigera-compliance-list-download-all-reports
subjects:
  - kind: User
    name: candice
    apiGroup: rbac.authorization.k8s.io
roleRef:
  kind: ClusterRole
  name: tigera-compliance-list-download-all-reports
  apiGroup: rbac.authorization.k8s.io

---
kind: ClusterRole
apiVersion: rbac.authorization.k8s.io/v1
metadata:
  name: tigera-compliance-list-download-dev-inventory
rules:
  - apiGroups: ['projectcalico.org']
    resources: ['globalreports']
    verbs: ['list']
  - apiGroups: ['projectcalico.org']
    resources: ['globalreports']
    verbs: ['get']
    resourceNames: ['dev-inventory']
  - apiGroups: ['projectcalico.org']
    resources: ['globalreporttypes']
    verbs: ['get']
    resourceNames: ['dev-inventory']

---
kind: ClusterRoleBinding
apiVersion: rbac.authorization.k8s.io/v1
metadata:
  name: tigera-compliance-list-download-dev-inventory
subjects:
  - kind: User
    name: david
    apiGroup: rbac.authorization.k8s.io
roleRef:
  kind: ClusterRole
  name: tigera-compliance-list-download-dev-inventory
  apiGroup: rbac.authorization.k8s.io
Configure and schedule reports
To configure and schedule a compliance report, create a GlobalReport with the following information.
| Fields | Description |
|---|---|
| name | Unique name for your report. |
| reportType | One of the following predefined report types: inventory, network-access, policy-audit. |
| schedule | The start and end time of the report using crontab format. To allow for archiving, reports are generated approximately 30 minutes after the end time. A single report is limited to a maximum of two per hour. |
| endpoints | Optional. For inventory and network-access reports, specifies the endpoints to include in the report. For the policy-audit report, restricts audit logs to include only policies that apply to the selected endpoints. If not specified, the report includes all endpoints and audit logs. |
| jobNodeSelector | Optional. Limits report generation jobs to specific nodes. |
| suspend | Optional. Suspends report generation. All in-flight reports will complete, and future scheduled reports are suspended. |
GlobalReports can only be configured using kubectl (not calicoctl); and they cannot be edited in the Tigera Secure EE the web console.
The following sections provide sample schedules for the predefined reports.
Weekly reports, all endpoints
The following report schedules weekly inventory reports for all endpoints. The jobs that create the reports will run on the infrastructure nodes (e.g. nodetype == 'infrastructure').
apiVersion: projectcalico.org/v3
kind: GlobalReport
metadata:
  name: weekly-full-inventory
spec:
  reportType: inventory
  schedule: 0 0 * * 0
  jobNodeSelector:
    nodetype: infrastructure
Daily reports, selected endpoints
The following report schedules daily inventory reports for production endpoints (e.g. deployment == ‘production’).
apiVersion: projectcalico.org/v3
kind: GlobalReport
metadata:
  name: daily-production-inventory
spec:
  reportType: inventory
  endpoints:
    selector: deployment == 'production'
  schedule: 0 0 * * *
Hourly reports, endpoints in named namespaces
The following report schedules hourly network-access reports for the accounts department endpoints, that are specified using the namespace names: payable, collections and payroll.
apiVersion: projectcalico.org/v3
kind: GlobalReport
metadata:
  name: hourly-accounts-networkaccess
spec:
  reportType: network-access
  endpoints:
    namespaces:
      names: ['payable', 'collections', 'payroll']
  schedule: 0 * * * *
Daily reports, endpoints in selected namespaces
The following report schedules daily network-access reports for the accounts department with endpoints specified using a namespace selector.
apiVersion: projectcalico.org/v3
kind: GlobalReport
metadata:
  name: daily-accounts-networkaccess
spec:
  reportType: network-access
  endpoints:
    namespaces:
      selector: department == 'accounts'
  schedule: 0 0 * * *
Monthly reports, endpoints for named service accounts in named namespaces
The following schedules monthly audit reports. The audited policy is restricted to policy that applies to widgets/controller endpoints specified by the namespace widgets and service account controller.
apiVersion: projectcalico.org/v3
kind: GlobalReport
metadata:
  name: monthly-widgets-controller-tigera-policy-audit
spec:
  reportType: policy-audit
  schedule: 0 0 1 * *
  endpoints:
    serviceAccounts:
      names: ['controller']
    namespaces:
      names: ['widgets']
View report generation status
To view the status of a report, you must use the kubectl command. For example:
kubectl get globalreports.projectcalico.org daily-inventory.p -o yaml
In a report, the job status types are:
- lastScheduledReportJob: The most recently scheduled job for generating the report. Because reports are scheduled in order, the “end time” of this report will be the “start time” of the next scheduled report.
- activeReportJobs: Default = allows up to 5 concurrent report generation jobs.
- lastFailedReportJobs: Default = keeps the 3 most recent failed jobs and deletes older ones. A single report generation job will be retried up to 6 times (by default) before it is marked as failed.
- lastSuccessfulReportJobs: Default = keeps the 2 most recent successful jobs and deletes older ones.
Change the default report generation time
By default, reports are generated 30 minutes after the end of the report, to ensure all of the audit data is archived. (However, this gap does not affect the data collected “start/end time” for a report.)
You can adjust the time for audit data for cases like initial report testing, to demo a report, or when manually creating a report that is not counted in global report status.
To change the delay, go to the installation manifest, and uncomment and set the environment
TIGERA_COMPLIANCE_JOB_START_DELAY. Specify value as a Duration string.
Run reports
You can run reports at any time to specify a different start/end time, and if a scheduled report fails.
Calico Enterprise GlobalReport schedules Kubernetes Jobs, which create a single-run pod to generate a report and store it
in Elasticsearch. Because you need to run reports as a pod, you need higher permissions: allow create access for pods in namespace tigera-compliance using the tigera-compliance-reporter service account.
To run a report on demand:
-
Download the pod template corresponding to your installation method.
For management and standalone clusters:
curl -O https://downloads.tigera.io/ee/v3.23.1/manifests/compliance-reporter-pod.yamlFor managed clusters:
curl https://downloads.tigera.io/ee/v3.23.1/manifests/compliance-reporter-pod-managed.yaml -o compliance-reporter-pod.yaml -
Edit the template as follows:
- Edit the pod name if required.
- If you are using your own docker repository, update the container image name with your repo and image tag.
- Set the following environments according to the instructions in the downloaded manifest:
TIGERA_COMPLIANCE_REPORT_NAMETIGERA_COMPLIANCE_REPORT_START_TIMETIGERA_COMPLIANCE_REPORT_END_TIME
-
Apply the updated manifest, and query the status of the pod to ensure it completes. Upon completion, the report is available in the Calico Enterprise web console.
# Apply the compliance report podkubectl apply -f compliance-reporter-pod.yaml# Query the status of the podkubectl get pod <podname> -n tigera-compliance
Manually-generated reports do not appear in GlobalReport status.
Additional resources
- For details on configuring and scheduling reports, see Global reports
- For report field descriptions, see Compliance reports
- CIS benchmarks