Fine-tune multi-cluster management
Big picture
Fine-tune your multi-cluster management deployment for production.
How to
- Review log storage collection and retention
- Review service type for the management cluster
- Review user permissions
- Review user permissions for managed cluster log data
- Filter log data for a managed cluster in Kibana
Review log storage collection and retention
Because the management cluster stores all log data across your managed clusters, choose a size to accommodate your anticipated data volume. See Adjust log storage size.
Review service type for the management cluster
In the Install multi-cluster management guide, we used a NodePort service because it was the quickest way to expose the management cluster. But, there are drawbacks to using NodePort services, described in Defining a Service in Kubernetes. For production and high availability, choose a type of service that is scalable. We have tested both NodePort and LoadBalancer services. For both, a security rule/firewall rule is needed to allow connections to the management cluster.
The configuration for your service (regardless of type) should obey the following requirements:
- Uses TCP protocol
- Maps to port 9449 on the Manager (web console) pod
- Exists within the
tigera-managernamespace - Uses label selector
k8s-app: tigera-manager
The following is an example of a valid LoadBalancer service:
apiVersion: v1
kind: Service
metadata:
  name: tigera-manager-mcm
  namespace: tigera-manager
spec:
  type: LoadBalancer
  ports:
    - port: 9449
      protocol: TCP
      targetPort: 9449
  selector:
    k8s-app: tigera-manager
Using a LoadBalancer may require additional steps, depending on how you provisioned your Kubernetes cluster.
If you previously set up a management cluster with a service, don’t forget to update the IP address in each managed clusters, by editing the ManagementClusterConnection manifest that you downloaded and apply it, or use kubectl edit managementclusterconnection tigera-secure.
Review user permissions
In the Install multi-cluster management guide, we created a user with full admin-level permissions in both the management and managed cluster. In a production environment you will want to define narrow permissions for your users.
When defining roles and permissions across your clusters, make note of the following:
- All users that log in to the Calico Enterprise web console must use a valid service account or user account in the management cluster.
- When the management cluster performs actions on a managed cluster, it passes the user ID of the current logged in user to the managed cluster for authorization. As a requirement, the user must have the same username defined across the management cluster and managed clusters. A user can have different permissions for accessing resources in each managed cluster, as defined by Kubernetes Role and ClusterRole objects, but the username used in the corresponding RoleBinding and ClusterRoleBinding objects must always match what is in the management cluster.
Review user permissions for managed cluster log data
Log data across all managed clusters is stored in a centralized Elasticsearch within the management cluster. You can use Kubernetes RBAC roles and cluster roles to define granular access to cluster log data. For example, using the RBAC rule syntax, you can define rules to control access to specific log types or specific clusters by using the resources and resourceNames list fields.
Calico Enterprise log data is stored within Elasticsearch indexes. The indexes have the following naming scheme:
<log-type>.<cluster-name>.<date>
A standalone cluster uses the cluster name cluster for Elasticsearch indexes. This is also the name used by a management cluster. For a managed cluster, its cluster name is the value chosen by the user at the time of registration, through the Calico Enterprise web console.
To restrict to a specific cluster or subset of clusters use, resources. To restrict to a specific log type use, resourceNames. The following are valid cluster types:
- “flows”
- “audit”
- “audit_ee”
- “audit_kube”
- “events”
- “dns”
- "l7"
Let’s look at some examples for defining RBAC rules within a role or cluster role to restrict access to log data by log type and cluster name.
The rule below allows access to log types flow and DNS for a single cluster with the name app-cluster.
- apiGroups: ['lma.tigera.io']
  resources: ['app-cluster']
  resourceNames: ['flows', 'dns']
  verbs: ['get']
The apiGroups will always be lma.tigera.io. The verbs will always be get.
The rule below allows access to any cluster for log types flow, DNS and audit.
- apiGroups: ['lma.tigera.io']
  resources: ['*']
  resourceNames: ['flows', 'dns', 'audit']
  verbs: ['get']
The rule below allows access to any cluster for all log types.
- apiGroups: ['lma.tigera.io']
  resources: ['*']
  resourceNames: ['*']
  verbs: ['get']
Filter log data for a managed cluster in Kibana
-
Log in to the Calico Enterprise web console.
-
In the left navigation, click Kibana and log in to the Kibana dashboard.
-
Navigate to the Discovery view and filter logs by managed cluster indexes.
-
Select a type of log (audit, dns, events, flow).
-
From the Available Fields section in the side panel, select the
_indexfield.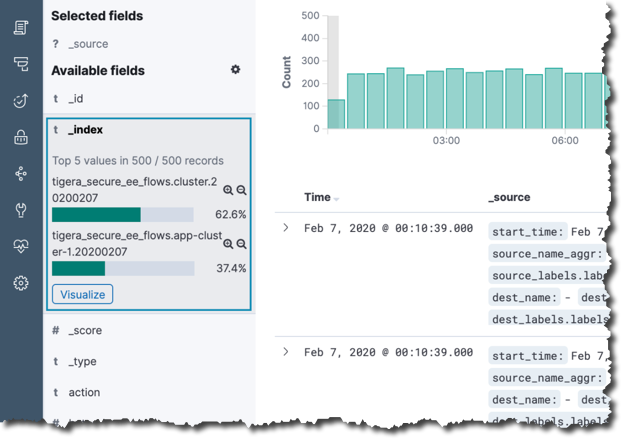
In the example above, the selected log type (flow logs) has the index prefix, tigera_secure_ee_flows and two cluster indexes available:
- Index: tigera_secure_ee_flows.cluster.20200207
- Index: tigera_secure_ee_flows.app-cluster-1.20200207
The management cluster has a default cluster name to identify indexes. When filtering logs for the management cluster, use the cluster name: cluster.
To filter log data by a given managed cluster you can include the filter criteria _index: <log type>.<cluster name>.* to your query when executing a search through the Kibana UI.