Configure L7 logs
Big picture
Deploy Envoy and use Calico Enterprise L7 logs to monitor application activity.
Value
Just like L3/4 Calico Enterprise logs, platform operators and development teams want visibility into L7 logs to see how applications are interacting with each other. Calico Enterprise flow logs only display which workloads are communicating with each other, not the specific request details. Calico Enterprise provides visibility into L7 traffic without the need for a service mesh.
L7 logs are also key for detecting anomalous behaviors like attempts to access applications, restricted URLs, and scans for particular URLs.
Concepts
About L7 logs
L7 logs capture application interactions from HTTP header data in requests. Data shows what is actually sent in communications between specific pods, providing more specificity than flow logs. (Flow logs capture data only from connections for workload interactions).
Calico Enterprise collects L7 logs by sending the selected traffic through an Envoy proxy.
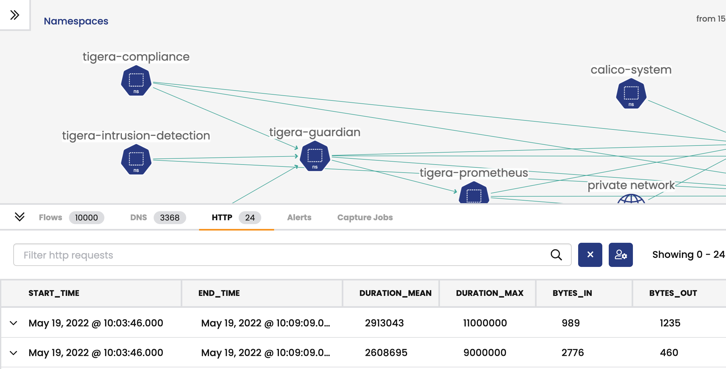
L7 logs are visible in the web console, service graph, in the HTTP tab.
Before you begin
Limitations
- L7 log collection is not compatible with a service mesh such as Istio.
- L7 log collection is not supported for host-networked client pods.
- L7 log collection is supported only on Kubernetes 1.29 and later.
When you enable L7 log collection for a deployment, all of that deployment's pods will restart. Selecting and deselecting traffic for L7 log collection may result in disruptions for active connections.
L7 logs require a minimum of 1 additional GB of log storage per node, per one-day retention period. Adjust your Log Storage before you start tasks in the next section.
Configure Felix for log data collection
-
Configure L7 log aggregation, retention, and reporting.
For help, see Felix Configuration documentation.
Configure L7 logs
In this step, you will configure L7 logs, select logs for collection, and test the configuration.
Configure the ApplicationLayer resource for L7 logs
-
Create or update the ApplicationLayer resource named,
tigera-secure.Example:
kubectl apply -f - <<EOFapiVersion: operator.tigera.io/v1kind: ApplicationLayermetadata:name: tigera-securespec:# log collection is implemented via sidecarsidecarInjection: Enabled# the following configures the log collection and aggregation behaviourlogCollection:collectLogs: EnabledlogIntervalSeconds: 5logRequestsPerInterval: -1EOFRead more about the log collection specification here.
Applying this resource creates an
l7-log-collectordaemonset incalico-systemnamespace. -
Wait for the Tigera APIServer deployment and Log collection daemonset to progress to ready.
kubectl rollout status -n calico-system deployment/calico-apiserver --timeout=120skubectl rollout status -n calico-system ds/l7-log-collector --timeout=120s
Quickstart: enable log collection on an example app
-
Install Google Microservices Demo
kubectl apply -f https://raw.githubusercontent.com/GoogleCloudPlatform/microservices-demo/refs/heads/main/release/kubernetes-manifests.yamlwithout the
-n <namespace>flag, it is going to be installed in thedefaultnamespace. if you wish to install in a different namespace, specify the-n <namespace>flag on all other commands in this tutorial from this point on. -
Patch the
frontendapplication deployment to start collecting L7 logs for this applicationkubectl patch deployment frontend -p '{"spec":{"template":{"metadata":{"labels":{"applicationlayer.projectcalico.org/sidecar":"true"},"annotations":{"applicationlayer.projectcalico.org/logging":"Enabled"}}}}}'The above command applies the following patch:
- ensures pods in your
frontenddeployment pod template spec has the labelapplicationlayer.projectcalico.org/sidecar: true - ensures pods in your
frontenddeployment pod template spec has the following annotations:
applicationlayer.projectcalico.org/logging: Enabled
Deployment pods will then be expected to restart. Monitor its progress with:
kubectl rollout status deployment frontendGoogle Microservices Demo includes a load generator. L7 logs should now start displaying log entries that can be viewed via various UIs
Alternatively, it is possible to test your configuration manually.
- ensures pods in your
-
To disable L7 log collection, reverse the above patch with the following command.
kubectl patch deployment frontend --type='json' -p '[{"op":"remove","path":"/spec/template/metadata/labels/applicationlayer.projectcalico.org~1sidecar"},{"op":"remove","path":"/spec/template/metadata/annotations/applicationlayer.projectcalico.org~1logging"}]'
Test your configuration
-
Identify the path to access your cluster. Where
<path>can be:- Public address of your cluster/service or
- Cluster IP of your application's service (if testing within the cluster)
-
curlyour service with a command similar to the following. You will seeServerheader asenvoy.curl --head <path to access service>:<optional port>/<path>
View L7 logs in the web console
Service Graph
To view L7 logs in Service Graph:
-
In the web console left navbar, click Service Graph.
-
In the bottom pane you will see L7 logs in the HTTP tab.
Kibana
To view L7 logs by index pattern in Kibana:
-
In the web console left navbar, click Kibana.
-
In the new Kibana browser, click the hamburger icon in the top left corner, and select Analytics, Discover.
-
Select the index pattern,
tigera_secure_ee_l7.