Web console tutorial
What you will learn
- Web console features and controls
- How to gain visibility into clusters
Let's go through each item in the web console left navbar from top to bottom. You can follow along using any cluster.
Dashboard
From the left navbar, click Dashboards.
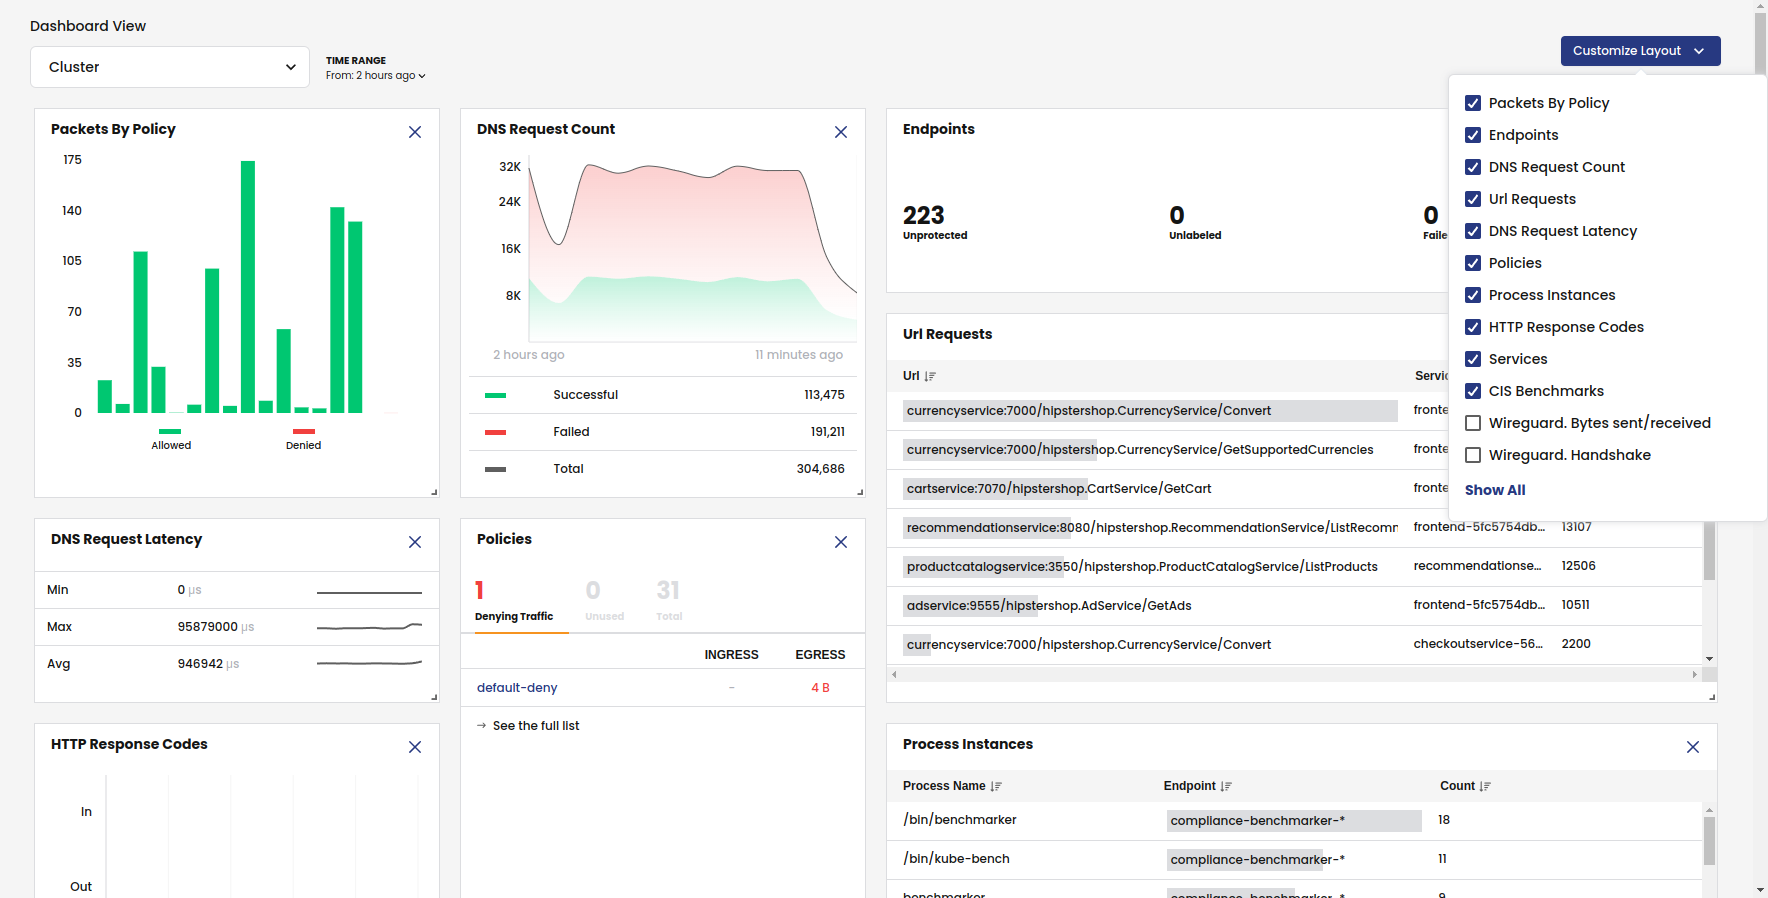
The Dashboard provides a birds-eye view of cluster activity. Note the following:
- The filter panel at the top lets you change dashboard views and the time range.
- The Layout Settings shows the default metrics. To get WireGuard metrics for pod-to-pod and host-to-host encryption, you must enable WireGuard.
- For application-related dashboard cards to show data, like HTTP Response Codes or Url Requests, you need to configure L7 logs.
Service Graph
From the left navbar, select Service Graph, Default
Service Graph provides a point-to-point, topographical representation of network traffic within your cluster. It is the primary tool for visibility and troubleshooting.
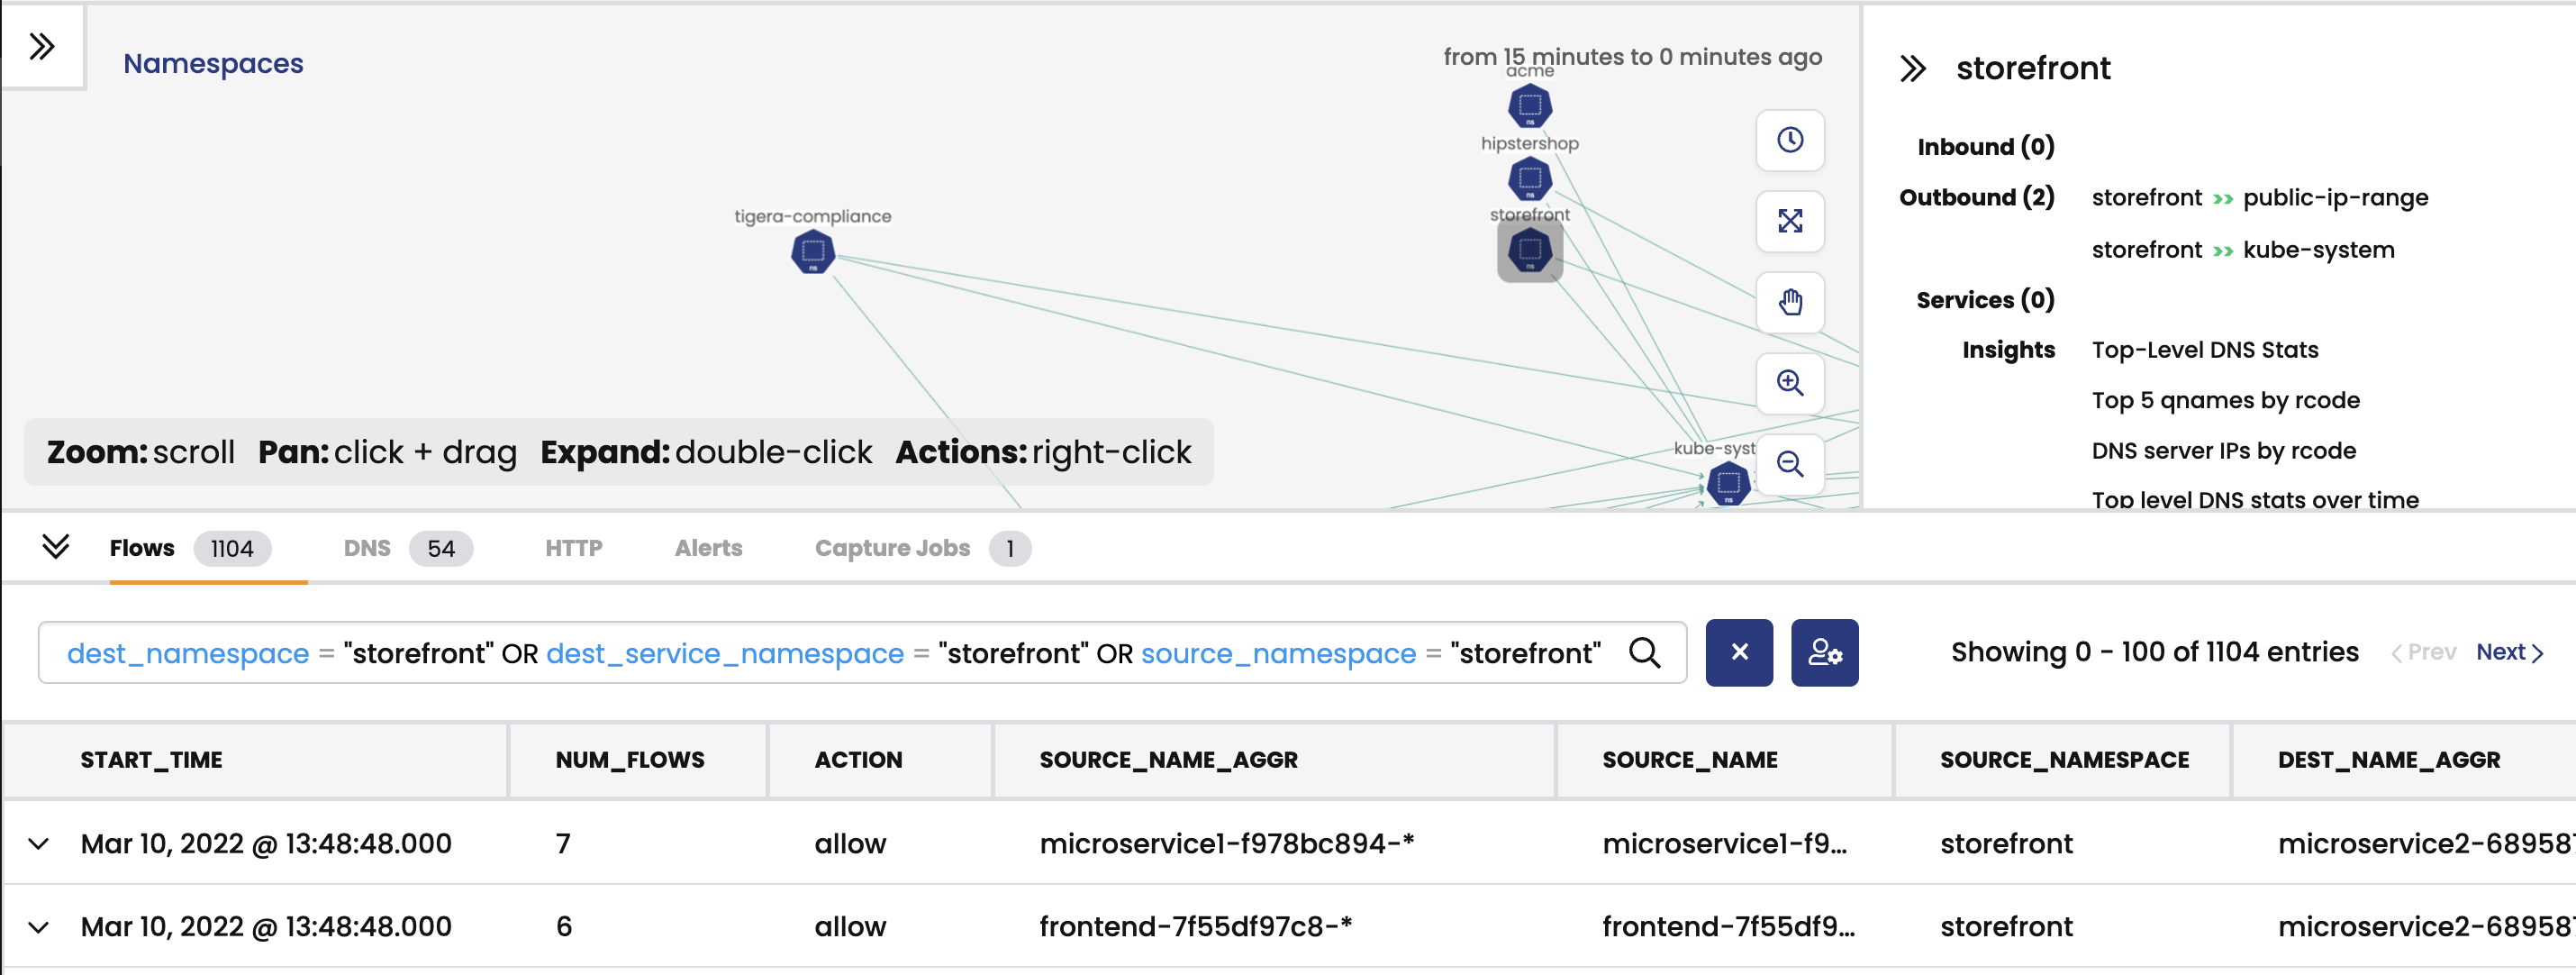
To learn more about Service Graph, see Network visualization.
Policies
From the left navbar, click Policies.
Network policy is the primary tool for securing a Kubernetes network. Policy is used to restrict network traffic (egress and ingress) in your cluster so only the traffic that you want to flow is allowed. Calico Enterprise supports these policies:
- Calico Enterprise network policy
- Calico Enterprise global network policy
- Kubernetes policy
Calico Enterprise uses tiers (also called, hierarchical tiers) to provide guardrails for managing network policy across teams. Policy tiers allow users with more authority (for example, Dev/ops users) to enforce network policies that take precedence over teams (for example, service owners and developers).
Policies Board is the default view for managing tiered policies.
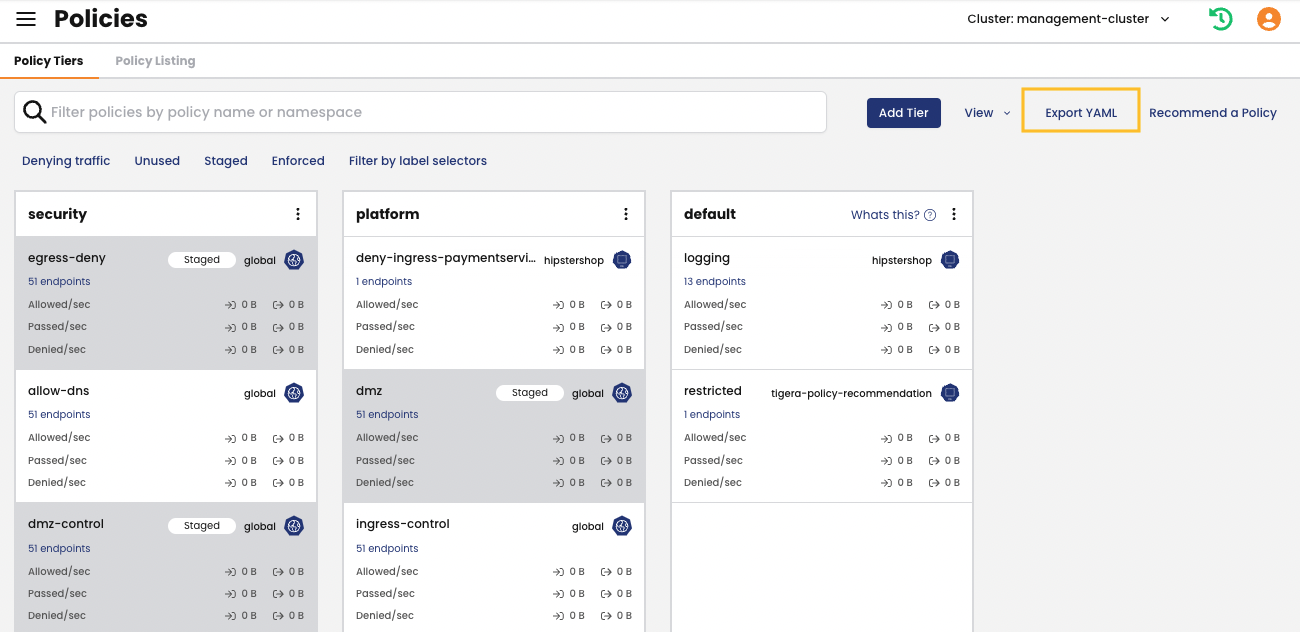
Users typically use a mix of Policy Board and YAML files. Note that you can export one or all policies in a tier to YAML.
The Policy Board lets you filter by name, namespace, policy types and label selectors.
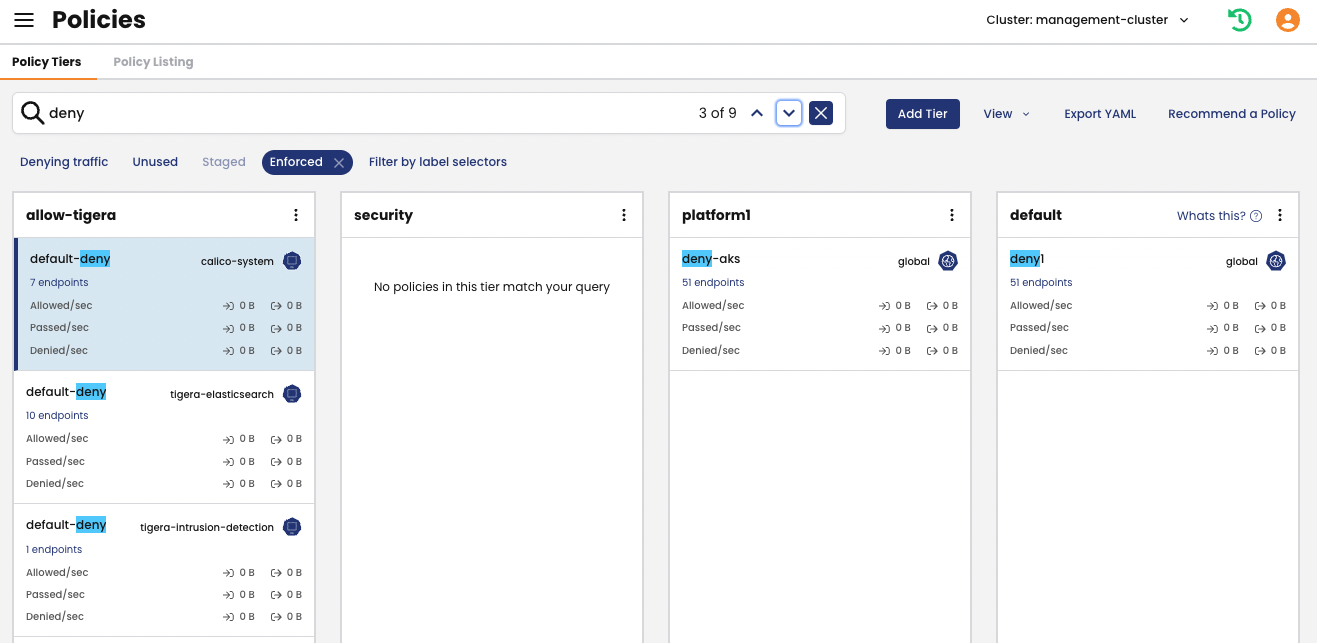
The following features provide more security and guardrails for teams.
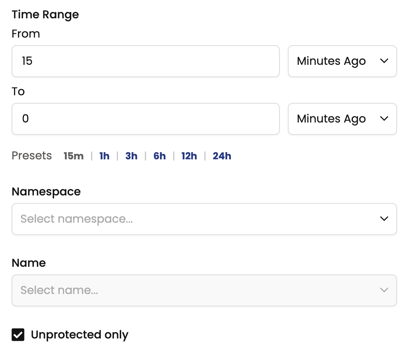
Recommended a policy
In Policies Board, click Recommend a policy.
One of the first things you'll want to do after installation is to secure unprotected pods/workloads with network policy. (For example, Kubernetes pods allow traffic from any source by default.) The Recommend a policy feature generates policies that protect specific endpoints in the cluster. Users with minimal experience with network policy can easily get started.
Policy stage
When you create a policy, it is a best practice to stage it to evaluate the effects before enforcing it. After you verify that a staged network policy is allowing traffic as expected, you can enforce it.

Preview
When you edit a policy, you can select Preview to see how changes may affect existing traffic.

Endpoints
From the left navbar, click Endpoints.
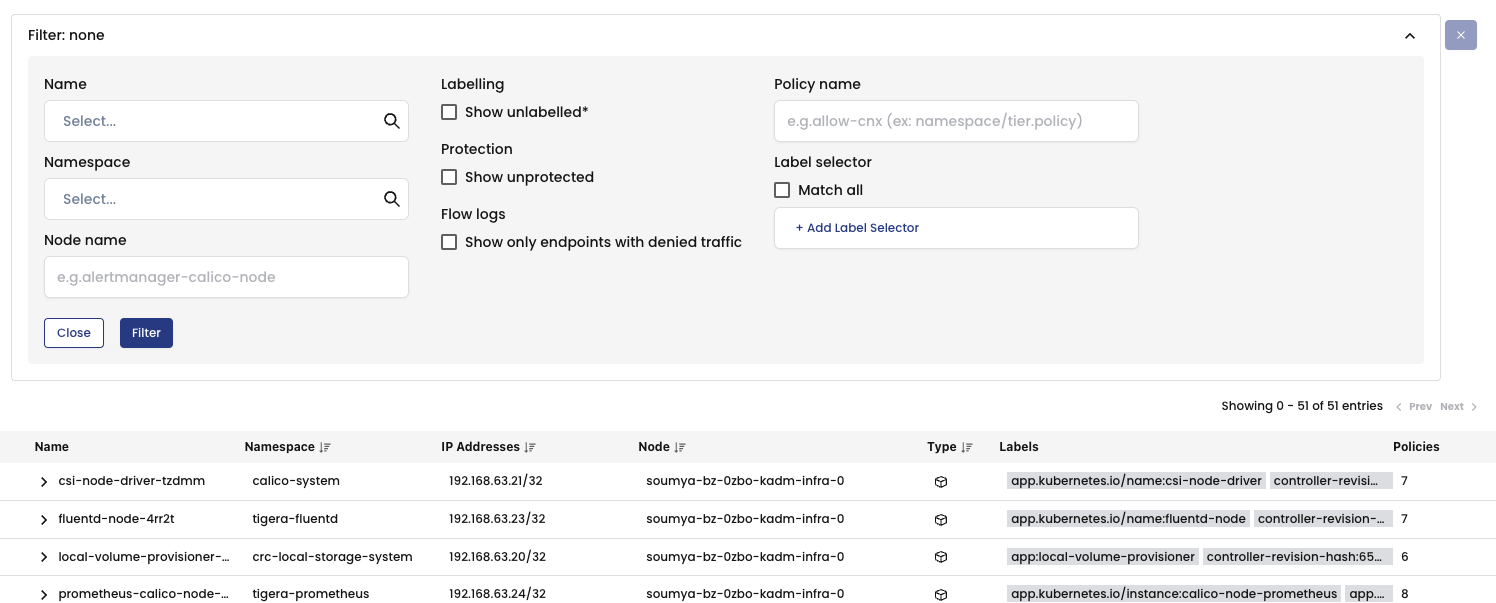
Endpoint Details
This page is a list of all pods in the cluster (also known as workload endpoints).
Node List
This page lists all nodes associated with your cluster.

Network Sets
Network sets and global network sets are Calico Enterprise resources for defining IP subnetworks/CIDRs, which can be matched by standard label selectors in policy (Kubernetes or Calico Enterprise). They are a powerful feature for use/reuse and scaling policy.
A simple use case is to limit traffic to/from external networks. For example, you can create a global network set with "deny-list CIDR ranges 192.0.2.55/32 and 203.0.113.0/24", and then reference the network set in a global network policy. This also allows you to see this traffic in Service Graph.

Managed clusters
If you have configured Calico Enterprise for multi-cluster management, you will see the Managed clusters option in the left navbar.
From the left navbar, click Managed clusters.
This page is where you switch views between clusters in the web console. When you connect to a different cluster, the entire web console view changes to reflect the selected cluster.

Compliance Reports
From the left navbar, click Compliance.
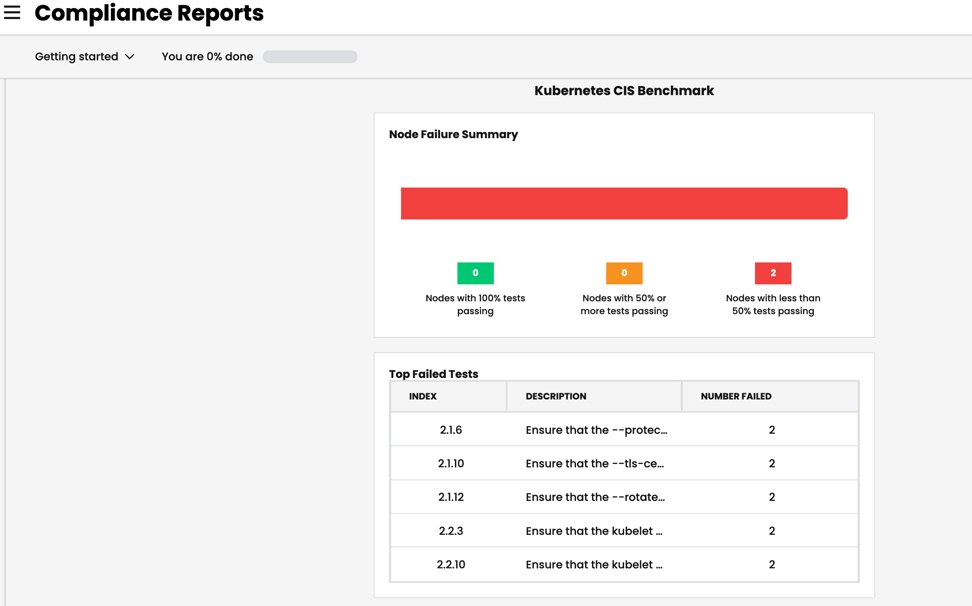
Compliance tools that rely on periodic snapshots, do not provide accurate assessments of Kubernetes workloads against your compliance standards. Calico Enterprise compliance dashboard and reports provide a complete inventory of regulated workloads, along with evidence of enforcement of network controls for these workloads. Additionally, audit reports are available to see changes to any network security controls.
Compliance reports are based on archived flow logs and audit logs for all Calico Enterprise resources, and audit logs for Kubernetes resources in the Kubernetes API server.
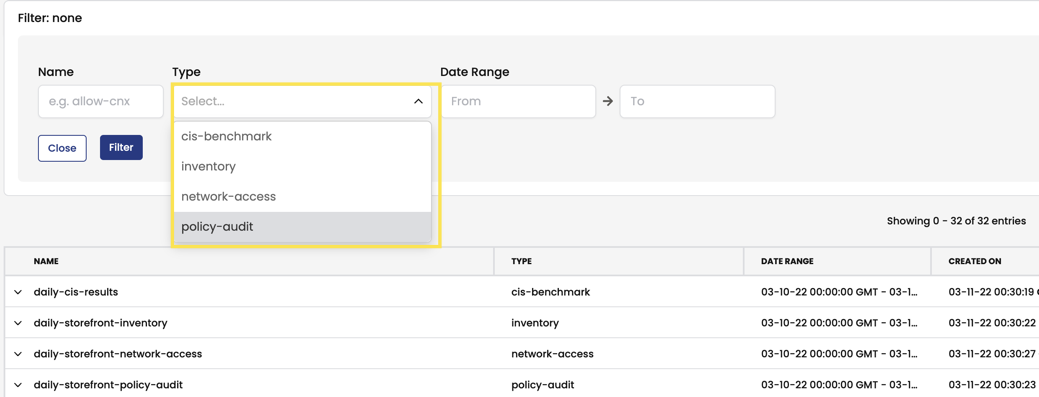
Using the filter, you can select report types.
Activity
From the left navbar, select Activity, Timeline.
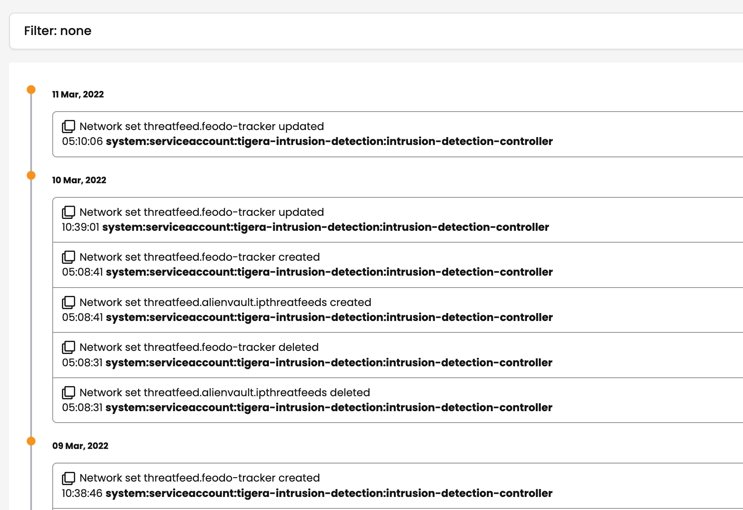
Timeline
What changed, who did it, and when? This information is critical for security. Native Kubernetes doesn’t provide an easy way to capture audit logs for pods, namespaces, service accounts, network policies, and endpoints. The Calico Enterprise timeline provides audit logs for all changes to network policy and other resources associated with your Calico Enterprise deployment.
From the left navbar, selection Activity, Alerts.
Alerts
How do you know if you have an infected workload? A possible threat? Calico Enterprise detects and alerts on unexpected network behavior that may indicate a security breach. You can create alerts for:
- Known attacks and exploits (for example, exploits found at Shopify, Tesla, Atlassian)
- DOS attempts
- Attempted connections to botnets and command and control servers
- Abnormal flow volumes or flow patterns based on machine learning
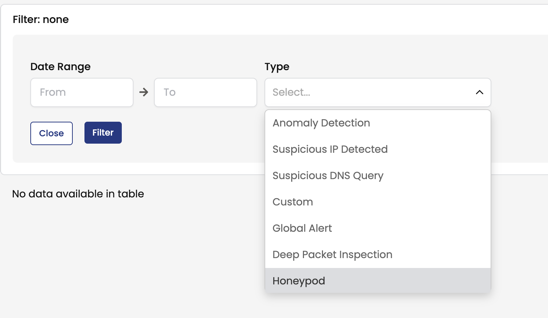
As shown, there are many types of alerts you can enable. None are enabled by default.
Logs
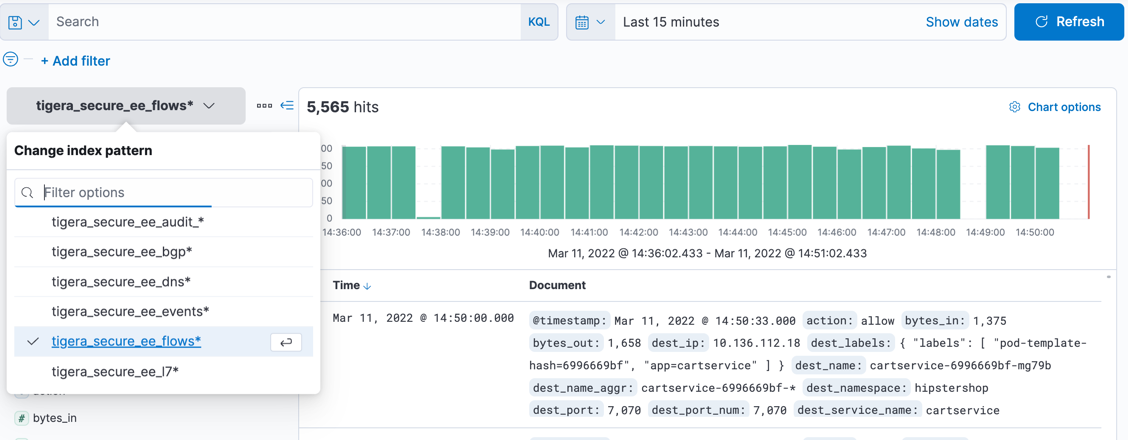
Calico Enterprise includes a fully-integrated deployment of Elastic to collect flow log data that drives key features like the Flow Visualizer, metrics in the Dashboard and Policy Board, policy automation, and testing features and security. Calico Enterprise also embeds Kibana so you can view raw log data for the traffic within your cluster.
From the left navbar, click Logs.
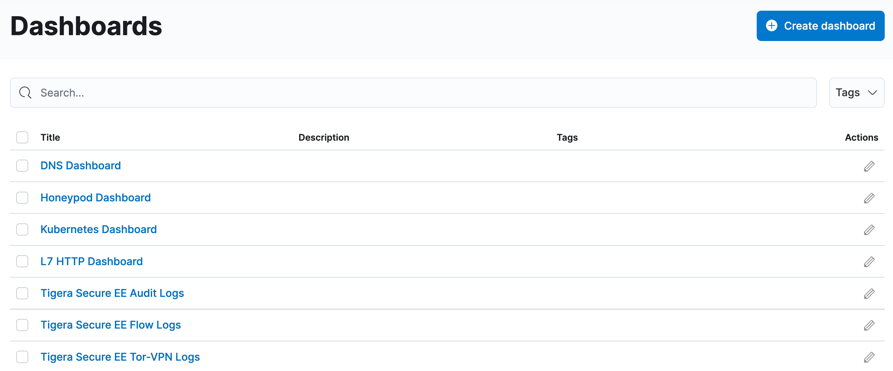
Dashboards
Calico Enterprise comes with built-in dashboards.
Log data
Kibana provides its own set of filtering capabilities to drill down into log data. For example, use filters to drill into flow log data for specific namespaces and pods. Or view details and metadata for a single flow log entry.
Threat feeds
You can add threat intelligence feeds to Calico Enterprise to trace network flows of suspicious IP addresses and domains. Then, you can use network policy to block pods from contacting IPs or domains.
Now that you understand the basics, we recommend the following: