Visualizing metrics via Grafana
Big picture
Use Grafana dashboard to view Calico component metrics.
Value
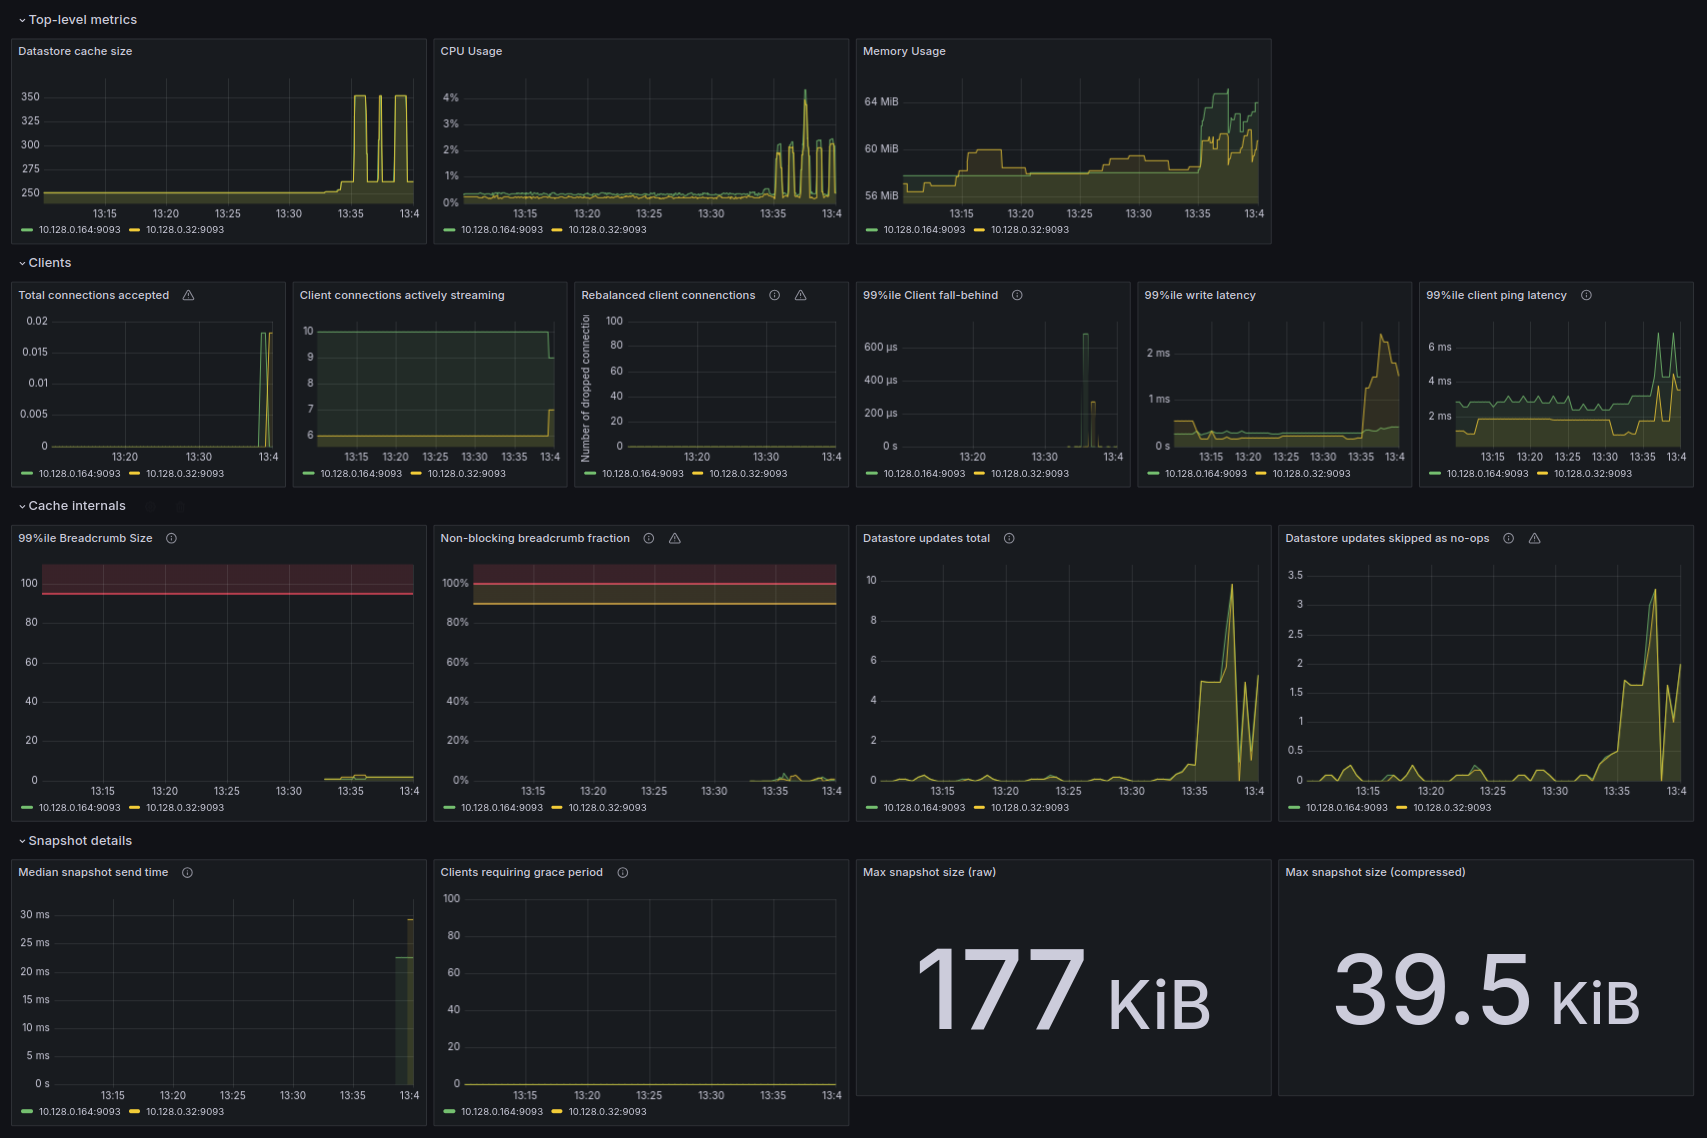
Using Grafana can be beneficial by providing a means to visualize metrics through graphs that can help you quickly identify unusual activity. The following image shows some of the graphs and metrics that are available for you to leverage to achieve this goal.

Concepts
About Grafana
Grafana is an open source visualization and analytics tool that allows you to query, visualize, alert on, and explore metrics from a variety of data source, including Calico component metrics stored in Prometheus.
About Prometheus
Prometheus is an open source monitoring tool that scrapes metrics from instrumented components and stores them as time series data which can then be visualized using tools such as Grafana.
Before you begin...
In this tutorial we assume you have
- a running Kubernetes cluster with Calico, calicoctl and kubectl installed
- completed all steps in the monitor component metrics guide to set up Prometheus to gather Calico component metrics.
How to
This tutorial will go through the necessary steps to create Calico metrics dashboards with Grafana.
Preparing Prometheus
Here you will create a service to make your prometheus visible to Grafana.
kubectl apply -f - <<EOF
apiVersion: v1
kind: Service
metadata:
  name: prometheus-dashboard-svc
  namespace: calico-monitoring
spec:
  selector:
    app:  prometheus-pod
    role: monitoring
  ports:
  - port: 9090
    targetPort: 9090
EOF
Preparing Grafana pod
1. Provisioning datasource
Grafana datasources are storage backends for your time series data. Each data source has a specific Query Editor that is customized for the features and capabilities that the particular data source exposes.
Guide with greater detail about Grafana datasources can be found at this link.
In this section you will use Grafana provisioning capabilities to create a prometheus datasource.
Guide with greater detail about provisioning can be found at this link.
Here You setup a datasource and pointing it to the prometheus service in your cluster.
kubectl apply -f - <<EOF
apiVersion: v1
kind: ConfigMap
metadata:
  name: grafana-config
  namespace: calico-monitoring
data:
  prometheus.yaml: |-
    {
        "apiVersion": 1,
        "datasources": [
            {
               "access":"proxy",
                "editable": true,
                "name": "calico-demo-prometheus",
                "orgId": 1,
                "type": "prometheus",
                "url": "http://prometheus-dashboard-svc.calico-monitoring.svc:9090",
                "version": 1
            }
        ]
    }
EOF
2. Provisioning Calico dashboards
Here you will create a configmap with Felix and Typha dashboards.
kubectl apply -f https://raw.githubusercontent.com/projectcalico/calico/v3.31.4/manifests/grafana-dashboards.yaml
3. Creating Grafana pod
In this step you are going to create your Grafana pod using the config file that was created earlier.
Grafana uses port 3000 by default. A more detailed guide about how to modify this port can be found at this link.
kubectl apply -f - <<EOF
apiVersion: v1
kind: Pod
metadata:
  name: grafana-pod
  namespace: calico-monitoring
  labels:
    app:  grafana-pod
    role: monitoring
spec:
  nodeSelector:
    kubernetes.io/os: linux
  containers:
  - name: grafana-pod
    image: grafana/grafana:latest
    resources:
      limits:
        memory: "128Mi"
        cpu: "500m"
    volumeMounts:
    - name: grafana-config-volume
      mountPath: /etc/grafana/provisioning/datasources
    - name: grafana-dashboards-volume
      mountPath: /etc/grafana/provisioning/dashboards
    - name: grafana-storage-volume
      mountPath: /var/lib/grafana
    ports:
    - containerPort: 3000
  volumes:
  - name: grafana-storage-volume
    emptyDir: {}
  - name: grafana-config-volume
    configMap:
      name: grafana-config
  - name: grafana-dashboards-volume
    configMap:
      name: grafana-dashboards-config
EOF
4. Accessing Grafana Dashboard
At this step You have configured all the necessary components to view your Grafana dashboards.
By using port-forward feature expose Grafana to your local machine.
kubectl port-forward pod/grafana-pod 3000:3000 -n calico-monitoring
You can now access the Grafana web-ui at http://localhost:3000, if you prefer to visit the Felix dashboard directly click here.
Both username and password are admin.
After login you will be prompted to change the default password, you can either change it here (Recommended) and click Save or click Skip and do it later from settings.
Congratulation you have arrived at your Felix dashboard.
In this tutorial we have also prepared a Typha dashboard for you, if you are not using Typha in your cluster you can delete it safely via Grafana web-ui.
A more detailed guide about Typha detection and setup can be found at this link.
Cleanup
By executing below command, you will delete all Calico monitoring resources, including the ones created by following this tutorial, and the monitor component metrics guide.
kubectl delete namespace calico-monitoring