Observability
This guide explains what observability is and shows you how to use Calico's observability tools. With these tools, you can find and troubleshoot issues with workload communications, performance, and operations in a Kubernetes cluster.
You can get started with Calico by following our quickstart guide. You'll learn how to install Calico, secure a cluster with network policy, and monitor network traffic with Calico Whisker.
Overview
What is observability?
People use observability tools to understand a complex system by visually analyzing what's going on in that system. With Calico, that system is the cluster and the entities within it, such as the nodes, pods, resources, network policies, and so on. In complex systems with many dynamic, interconnected parts, observability tools provide an interactive, visual frontend. Without them, you would need to use a series of recursive commands in a terminal to obtain the same information.
Why use observability tools?
By design, Kubernetes is a dynamic, distributed system, and this can make it difficult to get the full picture of what's happening inside a cluster. This makes monitoring, managing, and troubleshooting your cluster difficult and time consuming. You may need to integrate multiple third-party tools to get the outputs you want.
Without observability tools, you may struggle with the following tasks:
- troubleshooting issues between services
- troubleshooting network issues, such as latency, dropped packets, or increases in load
- identifying workload interdependencies
- implementing security measures, such as network policies
- monitoring the health of a cluster and quickly identifying issues
What is Calico's approach to observability?
When Calico Enterprise or Calico Cloud is installed in a cluster, it collects a lot of information about the flows happening within it to provide purpose-built observability with microservice specificity. This comes without the additional need for a service mesh or for additional compute resources for log correlation and aggregation. This flow information is stored in Elasticsearch, and gives you visibility into the following areas:
- communication patterns and traffic flows of workloads
- dependencies and interactions between namespaces, pods, and microservices
- communication to external services
- workload performance (traffic volume and speeds)
- network policy mapping
- alerts (for threats)
This information can be used to monitor a cluster to ensure its network traffic is healthy. You can also identify issues as they occur, such as workloads communicating with the wrong endpoints, network slowdowns, and latency issues.
Calico Enterprise and Calico Cloud have a range of different observability tools that suit different purposes. For example, if you're implementing a security strategy such as microsegmentation, you can see workload interdependencies in order to write network policies (the Dynamic Service and Threat Graph). With the same tool, you can see the impact of those policies on traffic flows, or choose other tools that show all network policies (Policies Board), or volumetric cluster traffic (Flow Visualizer). If further troubleshooting is required, detailed queries can be made on logs (Kibana). Finally, built-in dashboards can be used for regular monitoring.
This document will go through the multiple use cases of observability tools, show you how to use them, and provide guidance on real-world troubleshooting scenarios.
Calico Open Source does not include UI-based observability tools. But you can set up your own integrations with general-purpose monitoring tools such as Prometheus and Grafana. However, these may lack the depth and specificity required, and they will require additional domain expertise and time. Additionally, kubectl can be used to list running pods, get network policies, and so on. Collecting these outputs is time consuming and requires manually stitching together data.
Observability tools for different uses
As mentioned, Calico Enterprise and Calico Cloud collect a lot of information on network traffic within a cluster. To maximize usability, flow metadata powers many observability tools within Calico Enterprise and Calico Cloud.
Each of these tools serves a different purpose. They can be distinguished by the type of information needed and by the level of detail required. For example, a predominantly healthy cluster should not require someone to read through lines and lines of flow logs to determine cluster health regularly. However, someone who has identified an issue with a workload may find it useful to do a deep dive into log files, and a tool that makes it easy to find the relevant logs would make the troubleshooting process more efficient. As such, in Calico Enterprise and Calico Cloud, there are many features that contribute to observability and provide a different level of detail that are suited to different cluster operations.
While the observability features discussed in this use case are commercial, Calico Open Source does allow you to create policies with a log action to get insights into traffic flows for defined endpoints. These logs can then be passed to other tools, such as Fluent Bit or Prometheus. This video shows a Calico Open Source and Prometheus integration. Using Grafana can be beneficial by providing a means to visualize metrics through graphs that can help you quickly identify unusual activity. This may be a sufficient method for you to monitor Calico Open Source metrics.
Cluster monitoring
As Kubernetes clusters often contain multiple distributed, dynamic resources, anyone responsible for managing a cluster needs an easy way to see important and critical data at a glance. Particularly for organizations with business-critical applications running in Kubernetes, a quick, easy-to-digest view of important cluster metrics is paramount for operational efficiency, reducing potentially expensive or reputation-damaging outages or slowdowns.
Dashboards combine disparate data sources into intuitive visualizations, providing multiple views in one. This provides a single place for teams to access real-time data, identify trends, and make informed decisions or take action quickly.
Calico Enterprise and Calico Cloud's built-in dashboards are intended for monitoring and maintaining the state of a healthy cluster, and may be a springboard for taking action or troubleshooting.
Cluster Health dashboard
This dashboard is for viewing the overall health of your cluster.
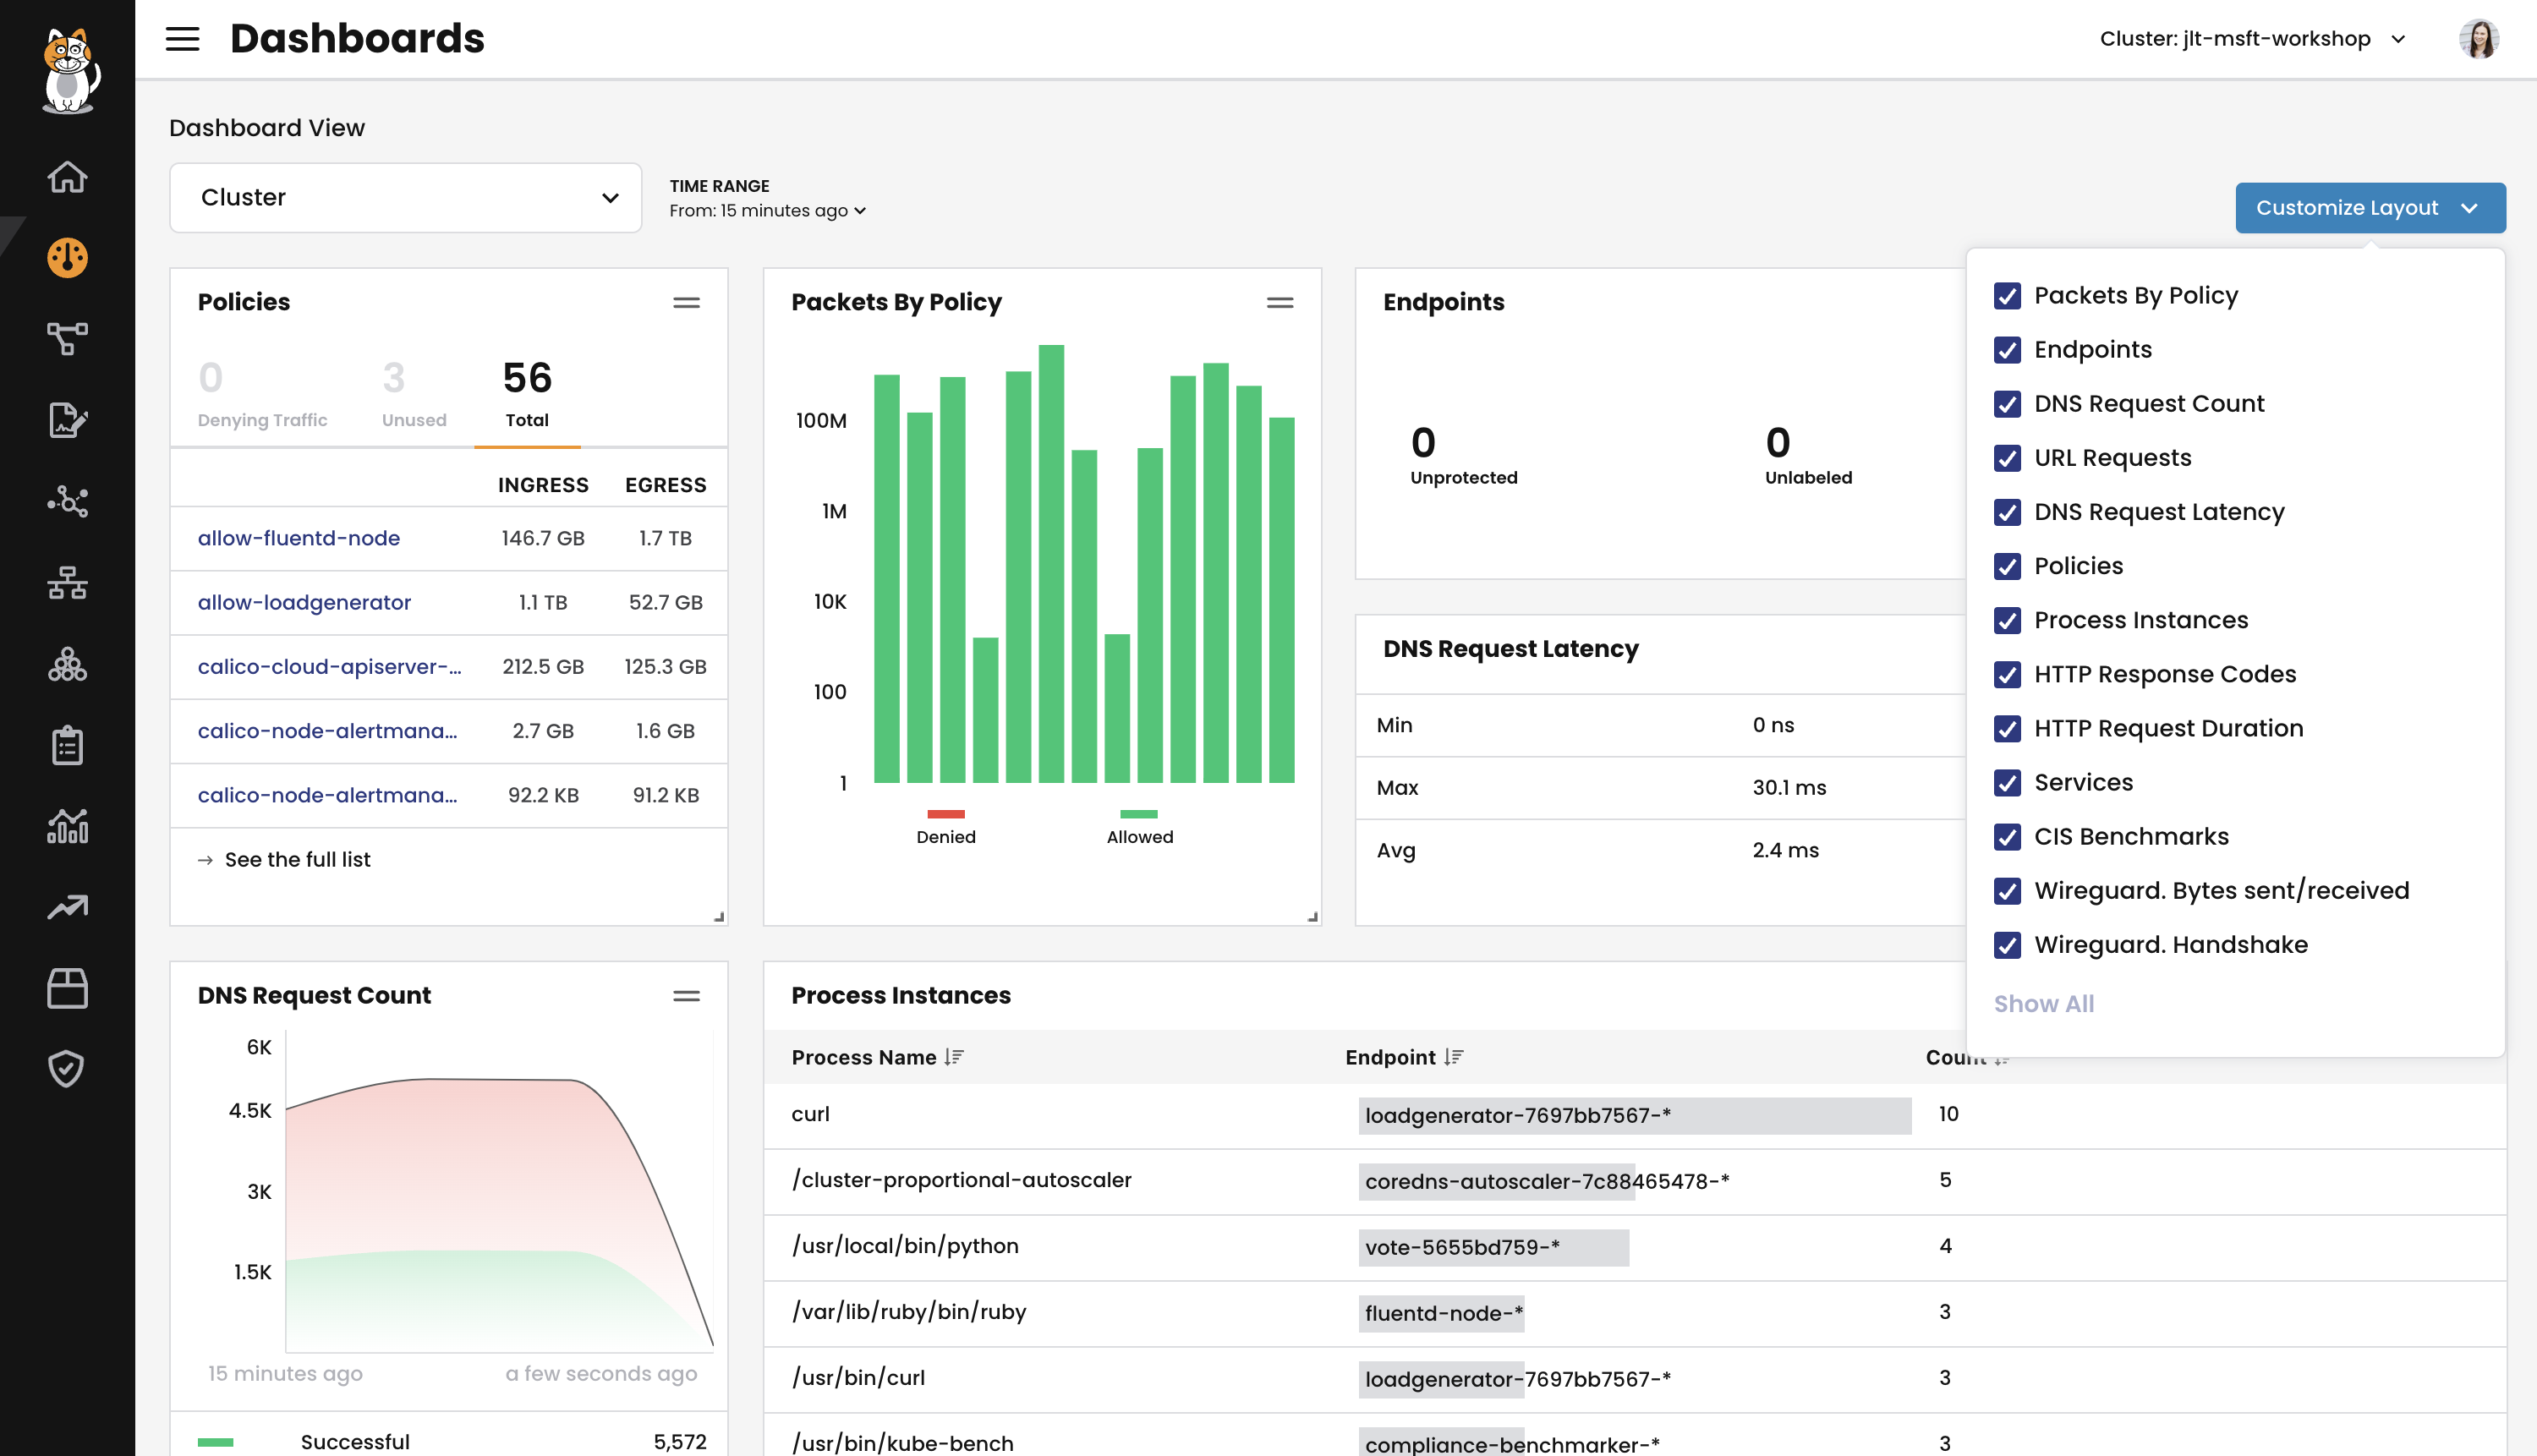
This is a customizable view for either a cluster or namespace that shows policies, endpoints, services, and more. This is available in Calico Enterprise and Calico Cloud. It provides an overview of network and security-related activities and behavior within a defined timeframe, such as:
- the number of policies, including unused or policies denying traffic
- DNS requests and their latency
- running processes and services
- HTTP requests, duration, and responses
If you are looking to quickly assess how secure your cluster is, with actionable insights:
Understanding cluster traffic and taking action
The next category of observability tools provide more detailed insights and information about cluster resources than a dashboard, but not at the level of detail logs would provide.
The observability tools that Calico Enterprise and Calico Cloud provides in this category are well suited to anyone who needs to get an understanding of how different resources in their cluster interact, what the dependencies are, and more details on communication patterns. This is crucial before implementing any security measures, allowing you to correctly design, validate and monitor.
In Calico Enterprise and Calico Cloud you can visualize cluster traffic topographically, making it easy to identify any namespaces or pods that might be experiencing issues, from denied network flows to security alerts. The two visualization capabilities are the Dynamic Service and Threat Graph and Flow Visualizer. Both tools show traffic flows, color-coded traffic actions (denied or allowed), and allow you to filter views to focus on a cluster view, namespace, or service. These tools are valuable when defining, applying, and reviewing network policy within a cluster because it is very easy to visualize dependencies and interactions between namespaces, pods, and microservices, and assess the impact of any network policy changes.
Network policy management and visualization
Calico Enterprise and Calico Cloud have an additional tool for network policy visibility and management. Creating network policy can be complex. Being able to observe all policies applied to a cluster in the correct order with the impacts of those policies visible can save you a lot of time when you're implementing and managing network policies.
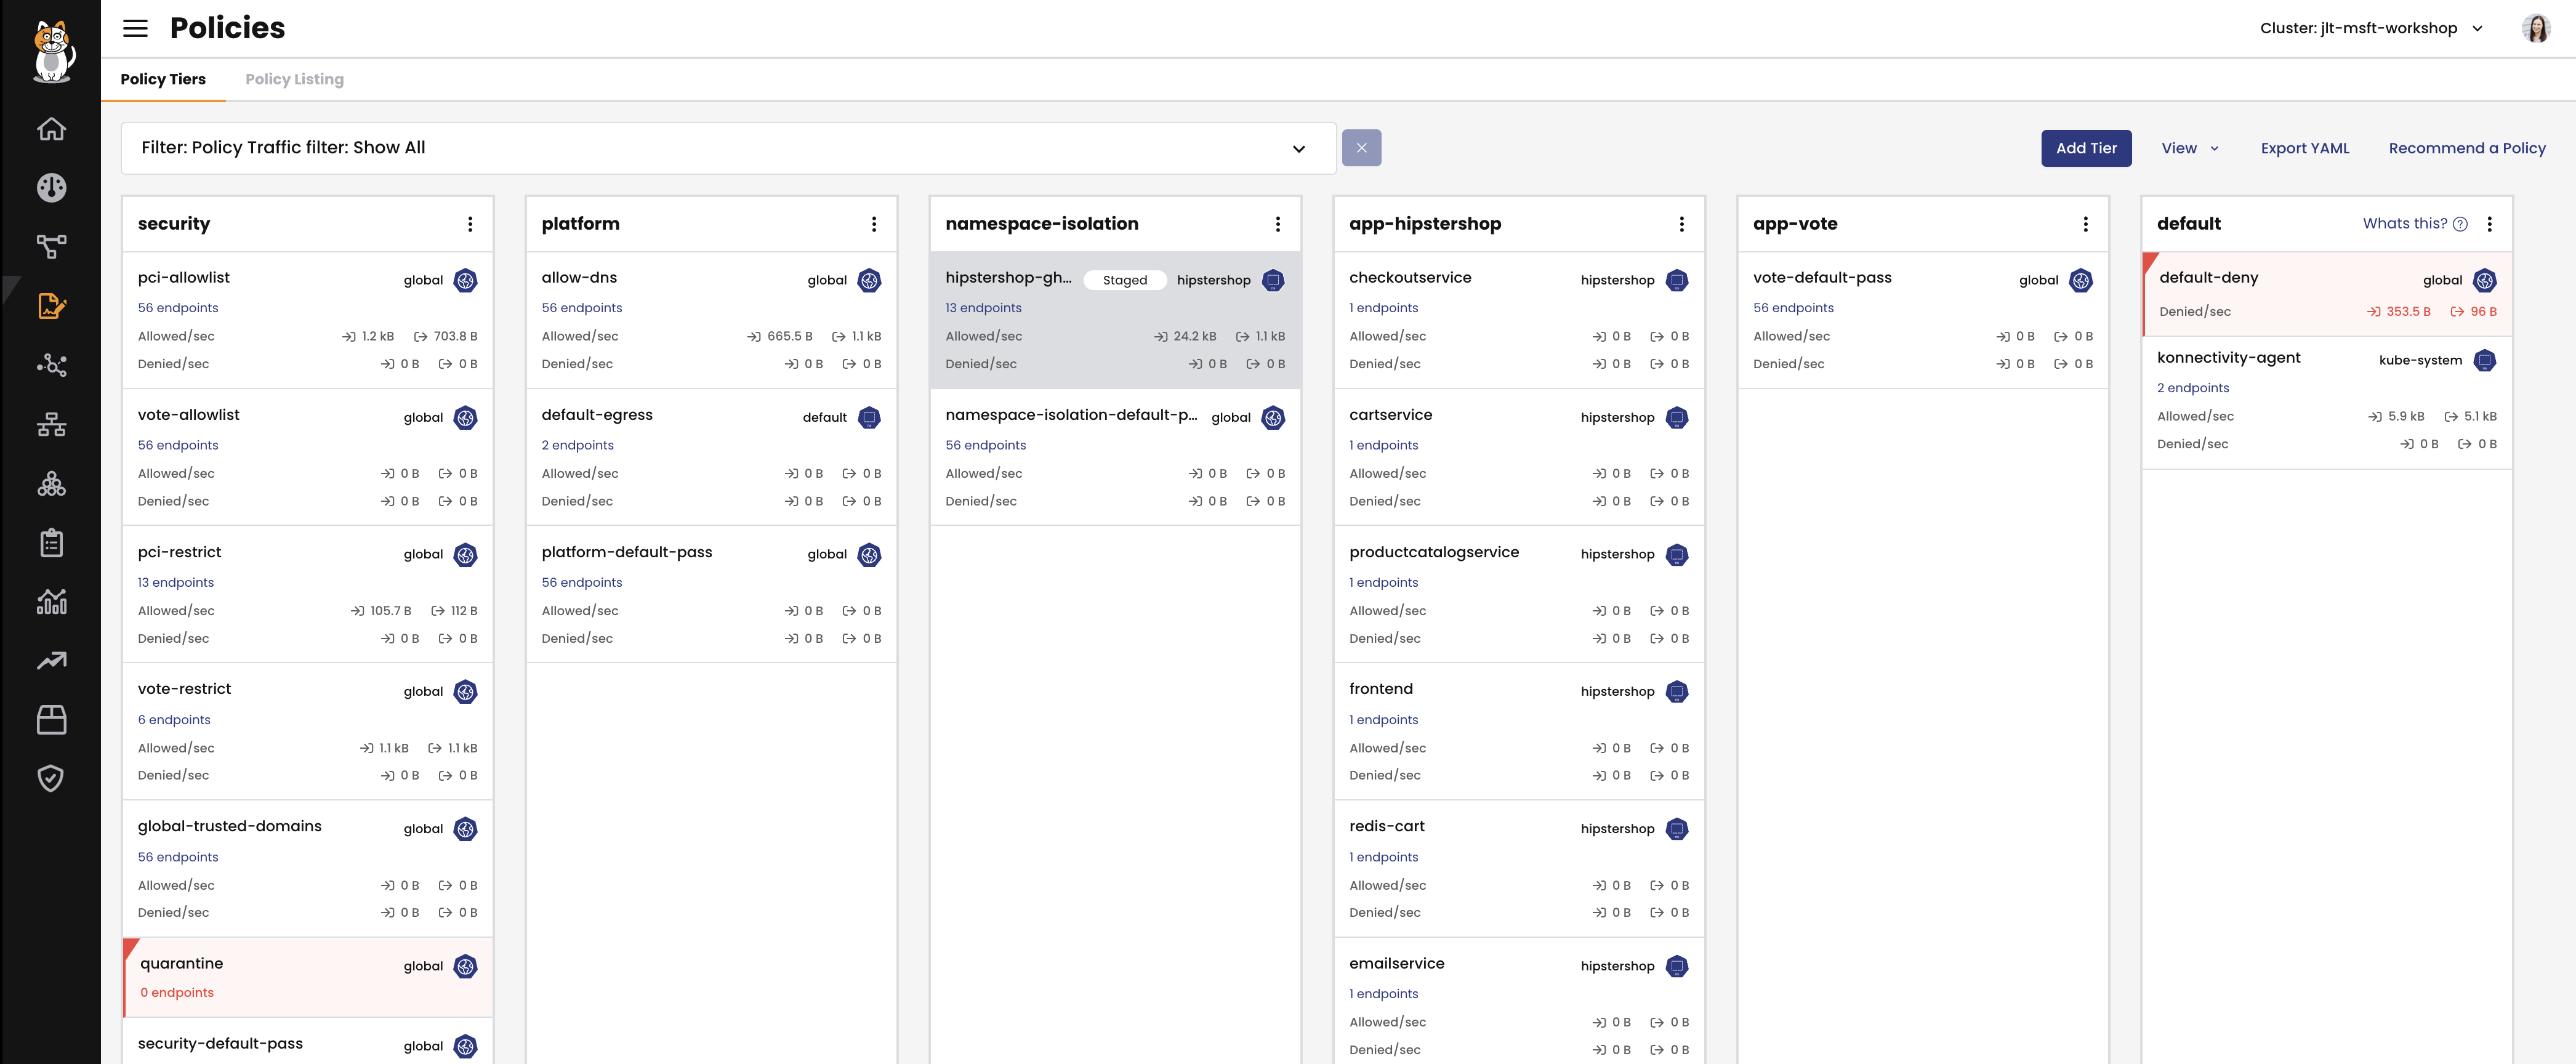
On the Policy Board, you can see all of the network policies applied to a cluster, which order and tier they're in, and whether a policy is allowing or denying traffic, and how many endpoints it's targeting.
Visualize cluster communications
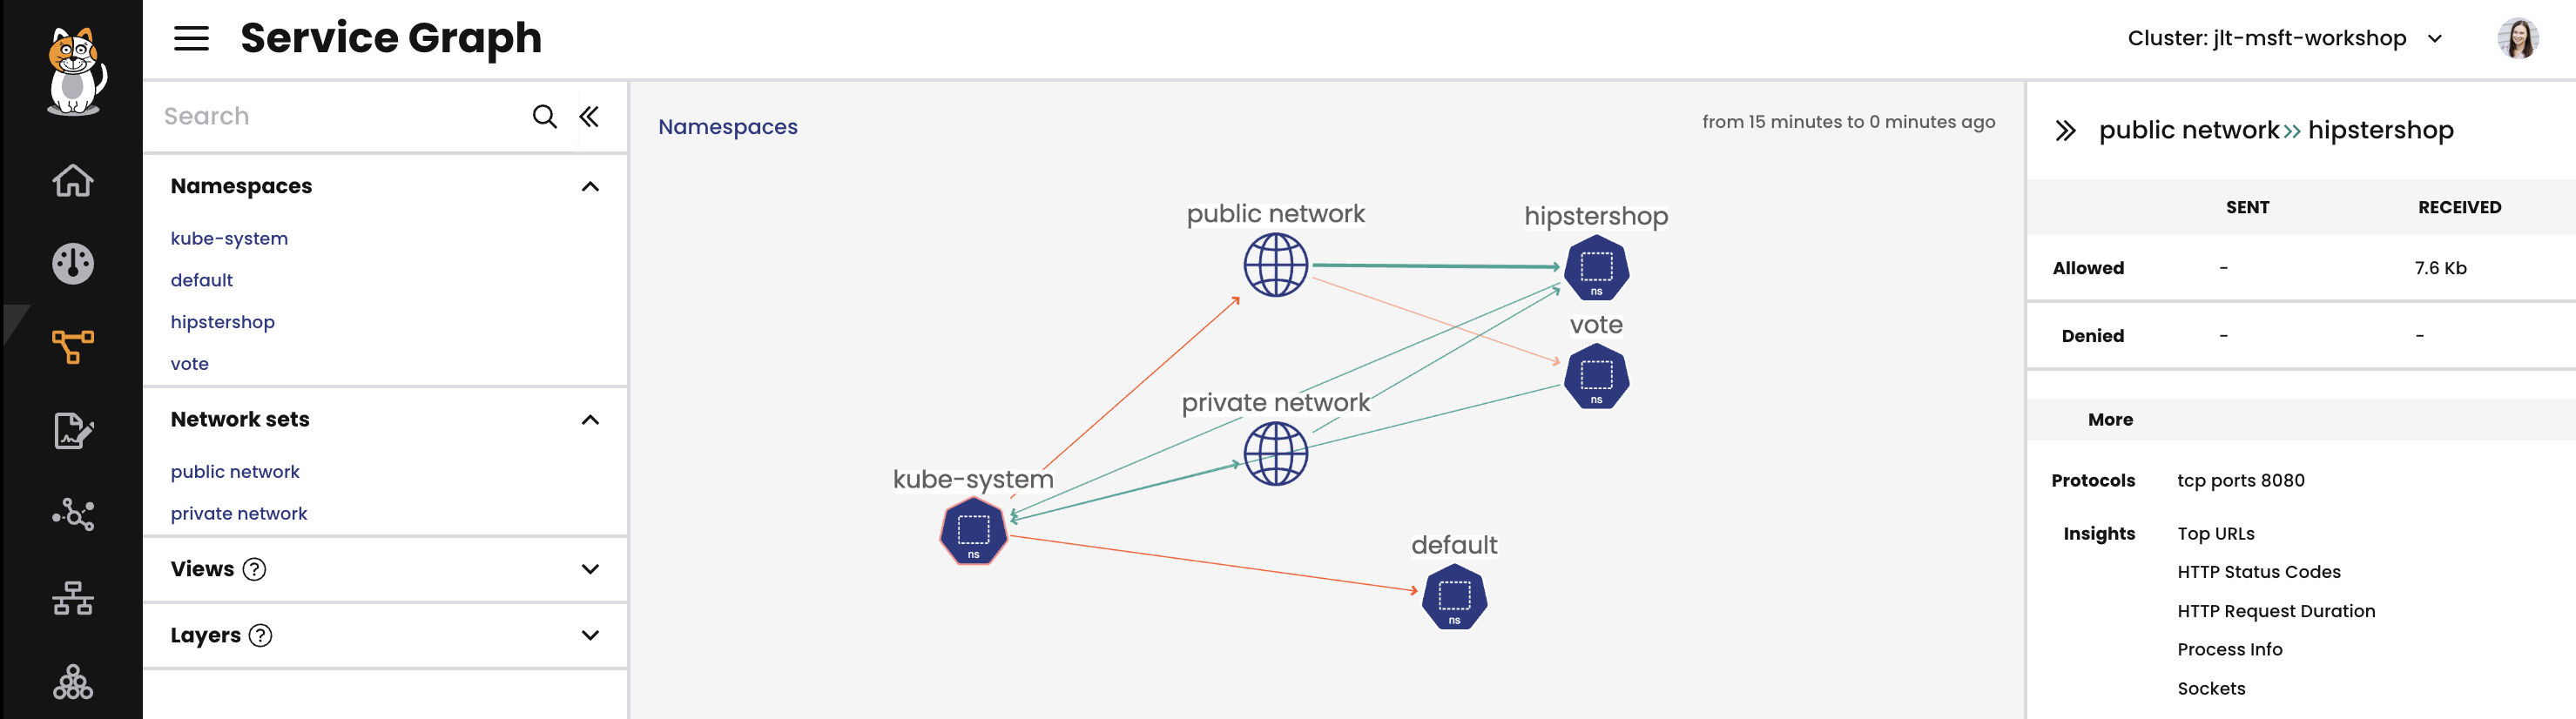
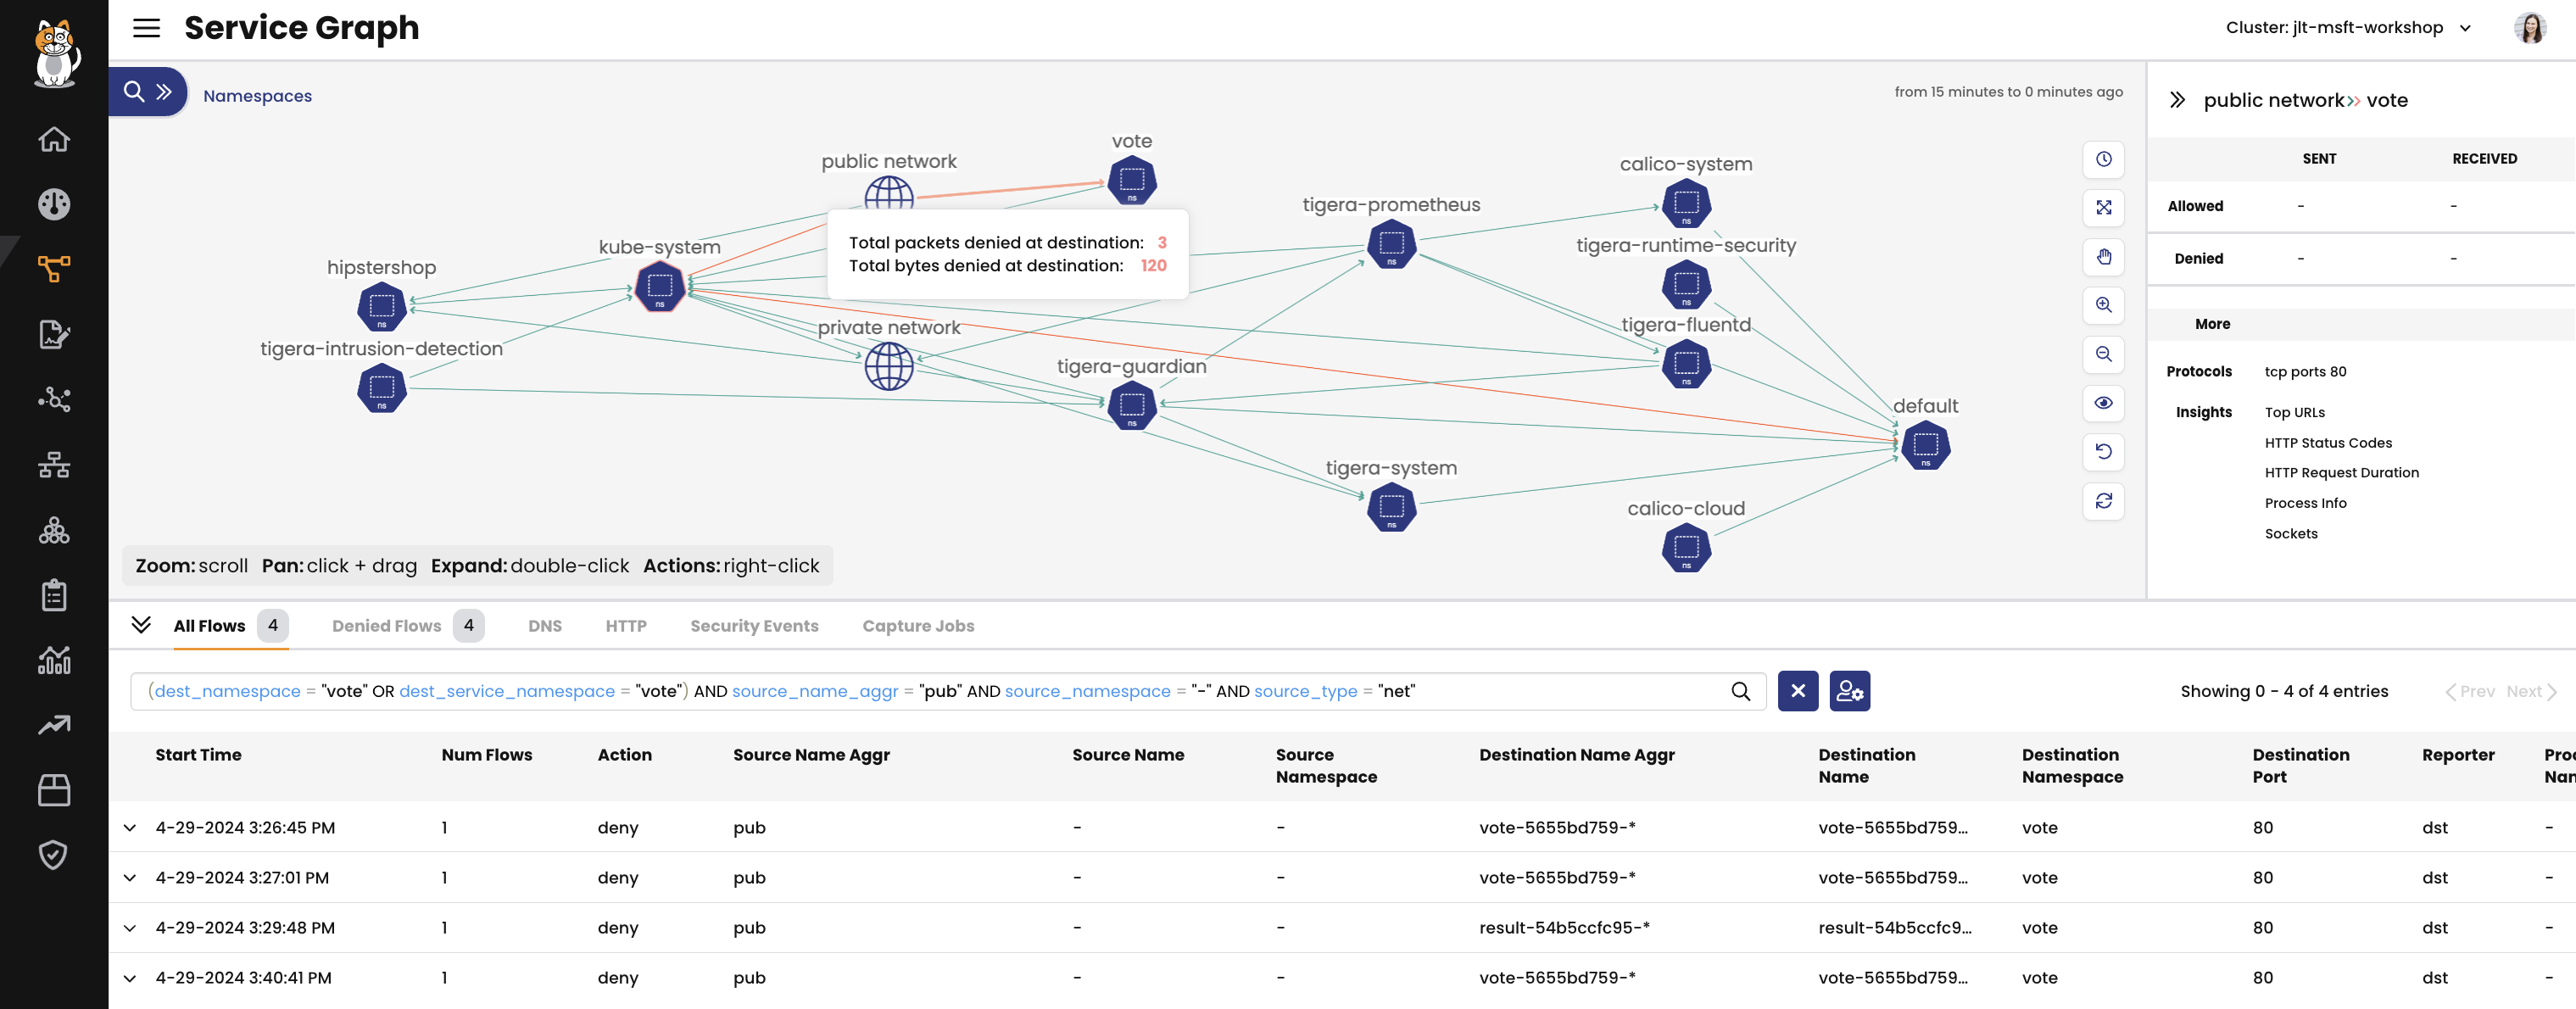
The Dynamic Service and Threat Graph provides a point-to-point, topographical representation of traffic within a cluster. In the Dynamic Service and Threat Graph, the default view shows a topographical view of network activity at a namespace level. You can change the view to look at other clusters. In the default view, double-click any icon to navigate to that resource (a namespace, for example), and then traffic will be visible at a workload level within that namespace.
Other troubleshooting or monitoring behaviors can be initiated or viewed from the Dynamic Service and Threat Graph, such as security events or packet captures. Security alerts will also be displayed visually, so that anyone viewing the cluster can quickly see any cause for concern and act.
A video walkthrough of the Dynamic Service and Threat Graph.
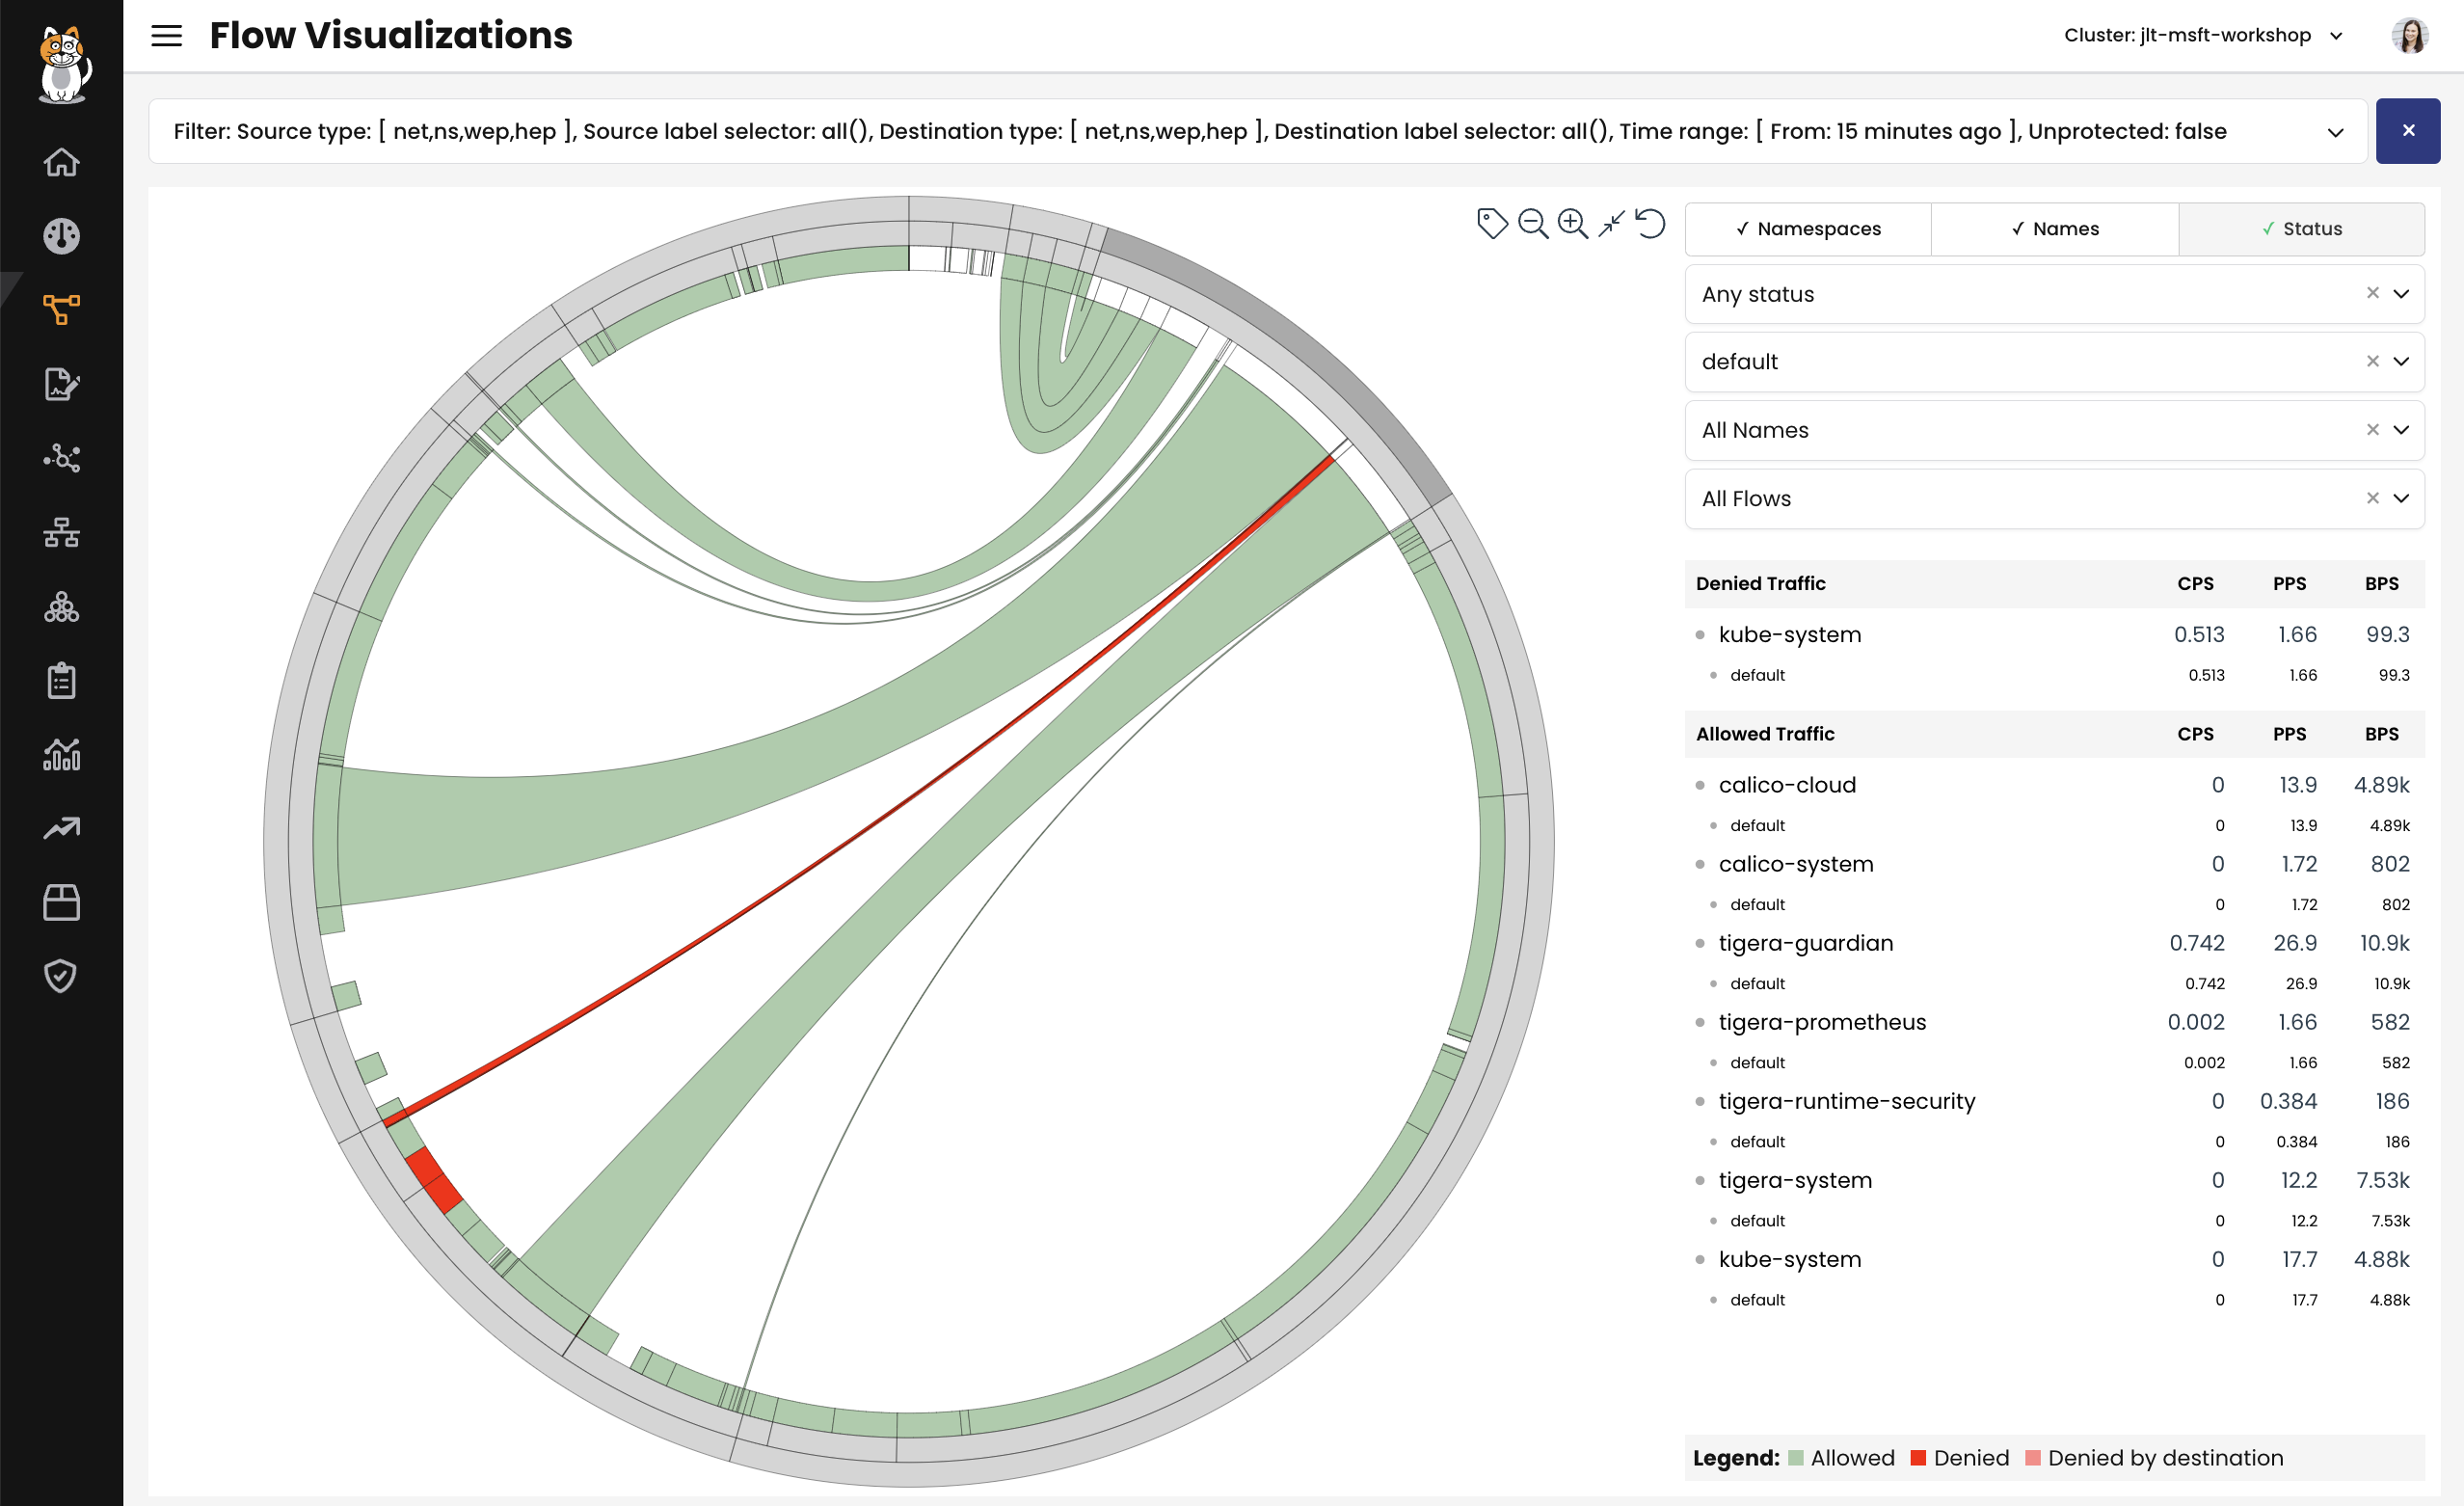
Flow Visualizer gives a 360-degree view of a cluster, where network traffic is represented volumetrically. The views, and color-coding of Flow Visualizer can be filtered on the right-hand side by namespace, service, or flow. Zooming in by clicking the magnifying glass shows a 360-degree view of traffic within the selected object.
When to use logs
If your visualization tools have highlighted a cause for concern that needs further investigation, analysis, or troubleshooting, then you will need more information.
This will likely be in the form of logs, which you can filter to target specific flows, workloads, or namespaces where the flow metadata can be reviewed. Logs typically hold all of the information relating to a flow, and that information is simplified or extracted to provide a clearer focus in dashboards or visualizations.
Using other tools before you analyze log files helps you narrow down the scope of troubleshooting or analysis. When you're ready to dive in to log files, you should already have a good idea of metadata to filter on or target, providing a more efficient approach to your investigation.
In Calico Enterprise and Calico Cloud, logs are stored in Elasticsearch. There are several different log types that are collected:
- Flow logs: Network flows for workloads, source and destination namespaces, pods, labels, and policies.
- Audit logs: Audit logs for Calico and Kubernetes resources.
- BGP: Calico networking, BGP peering and route propagation.
- DNS: DNS lookups and responses from Calico domain-based policy. (Because of their high volume, flow and dns logs support aggregation.)
- IDS: Calico intrusion detection events: suspicious IPs, suspicious domains, and global alerts.
Flow Logs are available through the Dynamic Service and Threat Graph, and automatically filter based on the view or selected resource.
The default view is to have the flow metadata collapsed, with the flow logs table configured with different columns to allow you to choose a table summary that best suits your needs.
Logs can also be viewed and queried through Kibana for more advanced use cases, and will be covered in the next section. Flow metadata provides an extra level of detail for understanding, investigating, and troubleshooting network flow issues, such as:
- identifying policy impact on traffic flow: which policies are evaluating traffic flow, in which order, is the flow allowed or denied
- which processes are initiating flows
- issues where connections could not be established
- changes in application or service load
- performance issues with latency or packets dropping
- knowing which IP addresses or FQDNs are communicating with your cluster
Customizable, detailed visualizations
Because Calico Enterprise and Calico Cloud store logs in Elasticsearch, these applications also provide Kibana as an interface to explore Elasticsearch logs and gain insights into workload communication, traffic volume, performance, and other key aspects of cluster operations. The dashboards in the web console are suited to anyone who needs to observe cluster health more generally. Kibana dashboards suit more advanced users who have a deeper understanding of the cluster and applications running within it, who are comfortable building queries and filters for more comprehensive insights or troubleshooting efforts.
Similarly, the flow logs paired with the Dynamic Service and Threat Graph are well suited to less complex troubleshooting, and useful when compared with cluster visualizations. More in-depth investigations will benefit from Kibana logs, where the full breadth of metadata is accessible and can be filtered and reviewed using more sophisticated queries and filters.
Kibana dashboards
There are a number of prebuilt dashboards in Kibana, such as:
- DNS dashboard
- L7 HTTP dashboard
- Tigera Secure EE audit logs dashboard
- Tigera Secure EE flow logs dashboard
- Tigera Secure EE Tor-VPN logs
Each dashboard has advanced filtering options if the prebuilt dashboards are insufficient.
As an example, the prebuilt DNS dashboard is shown below, which allows you to quickly identify DNS health and performance.
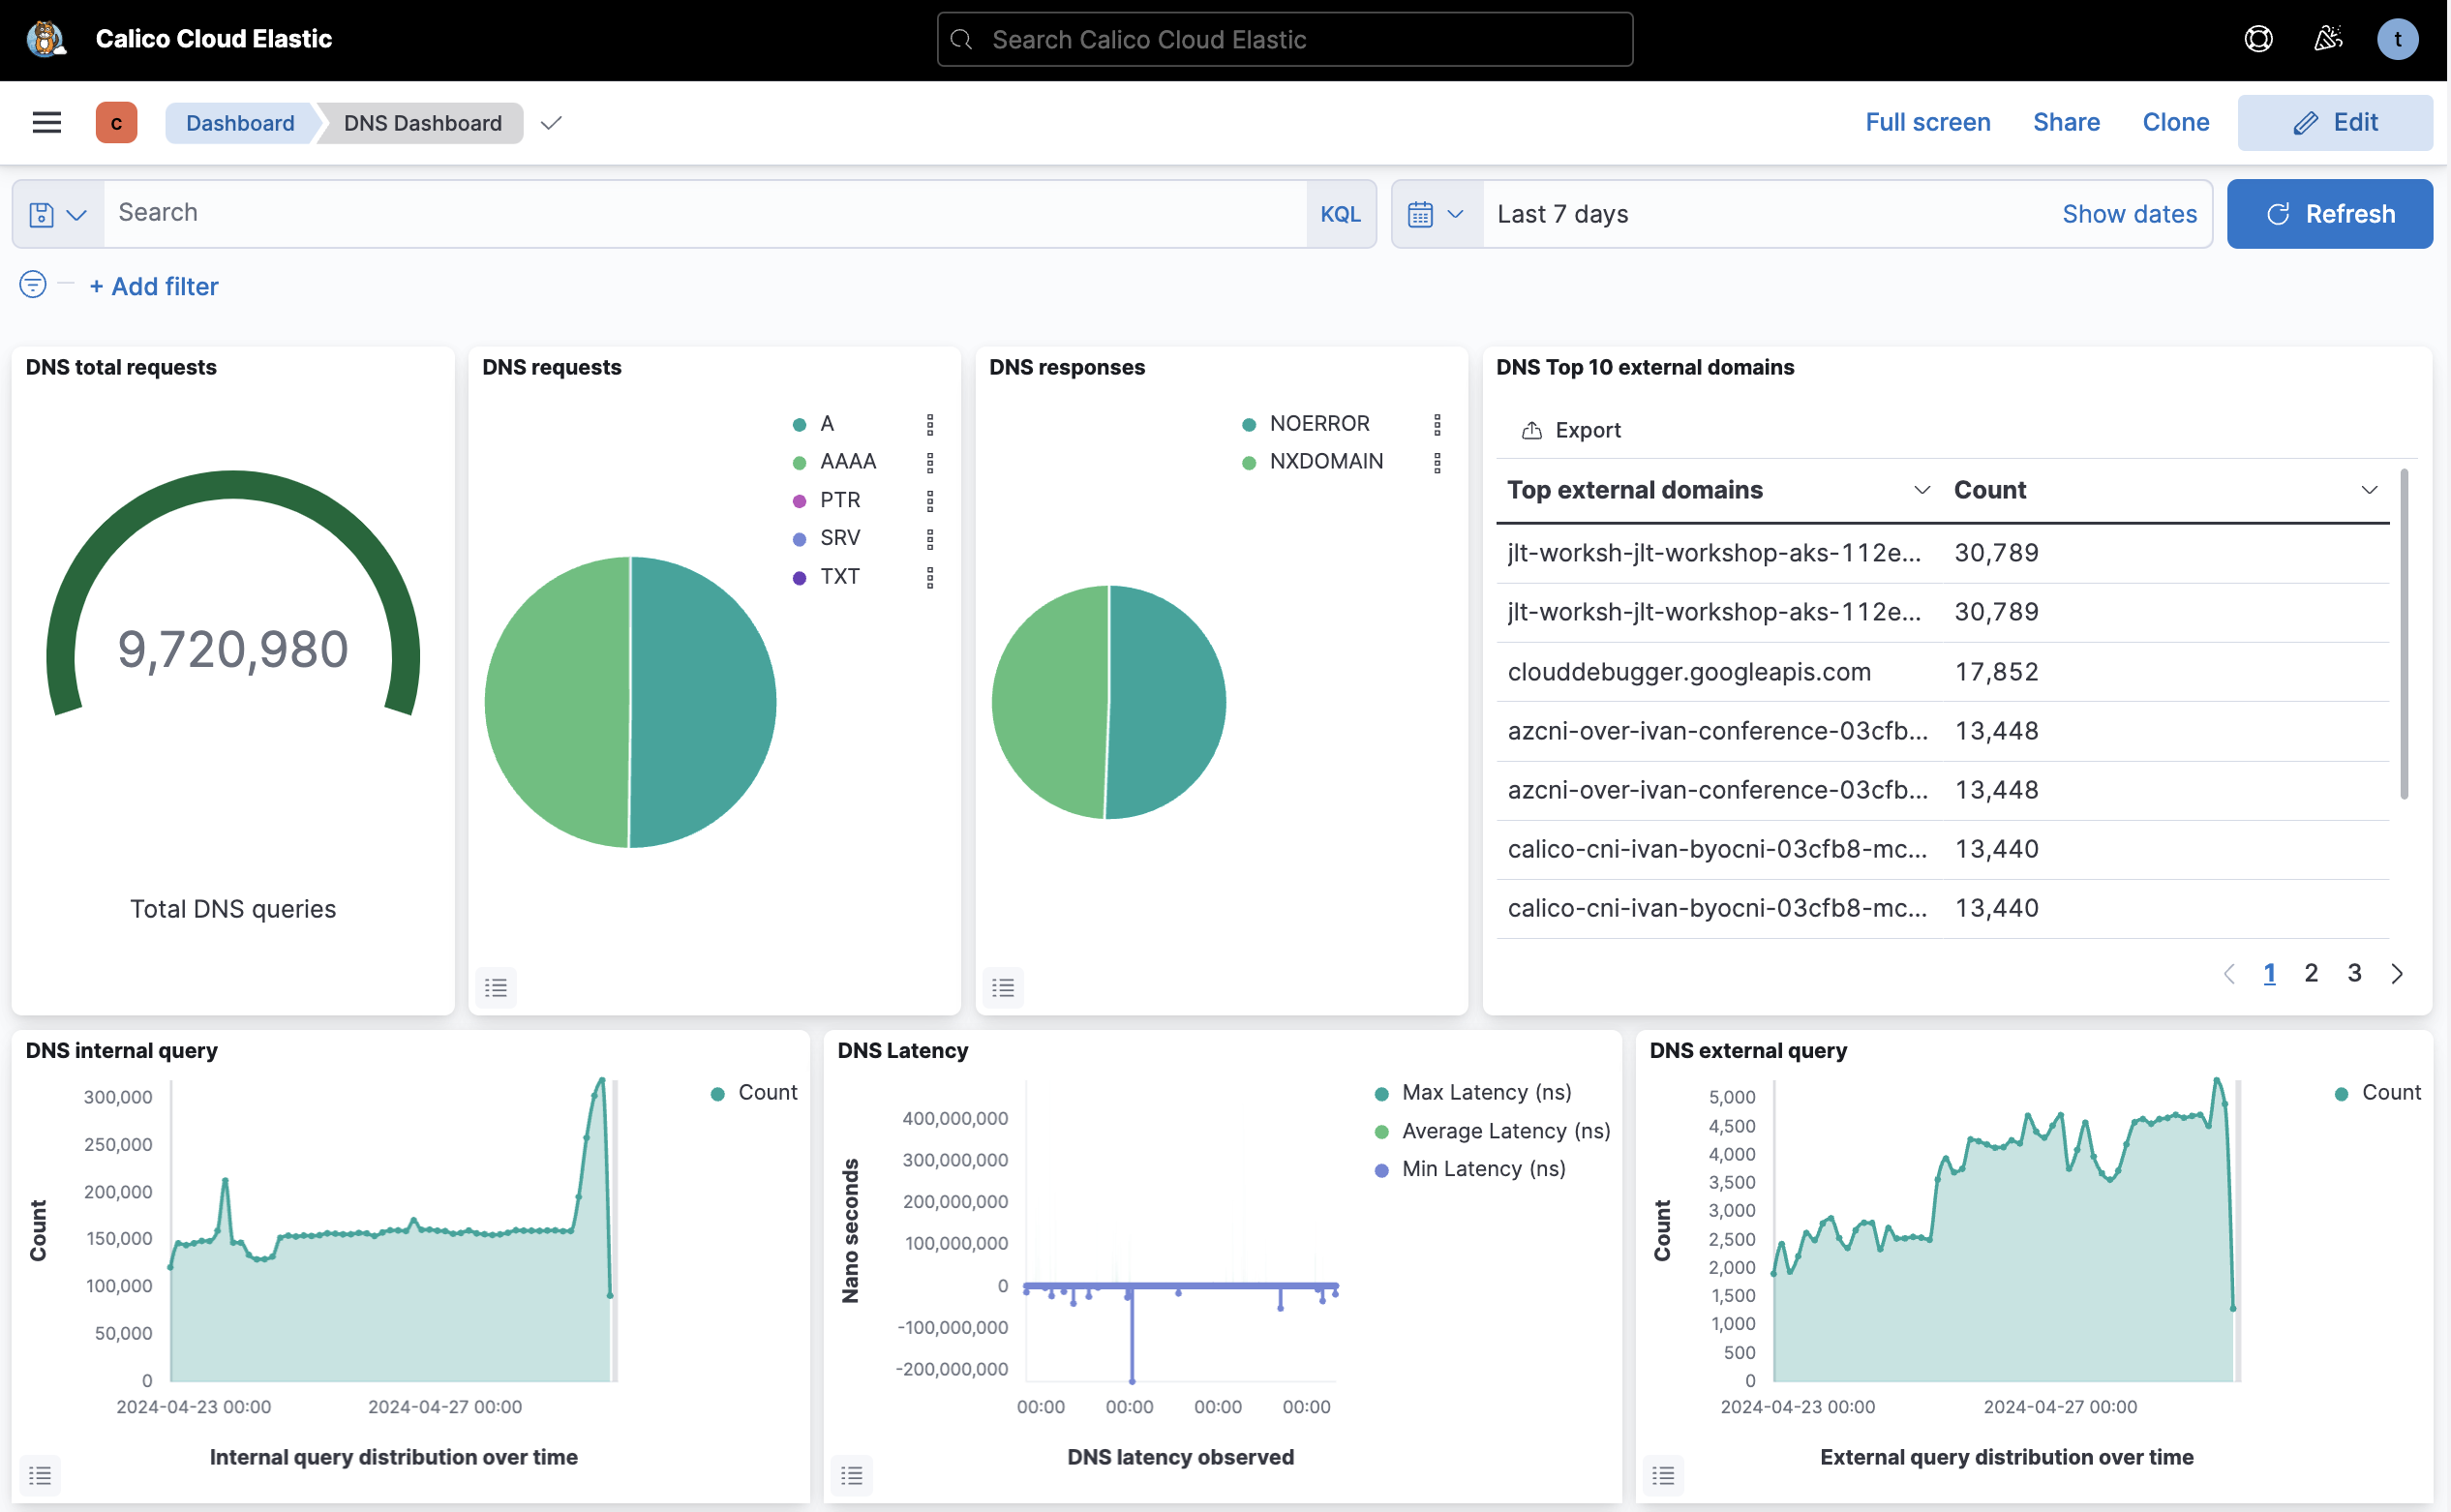
A targeted DNS dashboard provides one view for all DNS-related metrics, including:
- grouping DNS requests by the type of requested resource record
- identifying DNS response codes to distinguish successful and erroneous DNS resolution attempts
- monitoring external domain resolution to track connections to services outside the cluster
- analyzing the rate of DNS queries to identify potential performance bottlenecks
- measuring DNS response latency to pinpoint application performance issues.
Filters and queries can be added to dashboards to increase the level of detail, such as filtering for specific namespaces. It is possible to create new dashboards based on custom queries and filters.
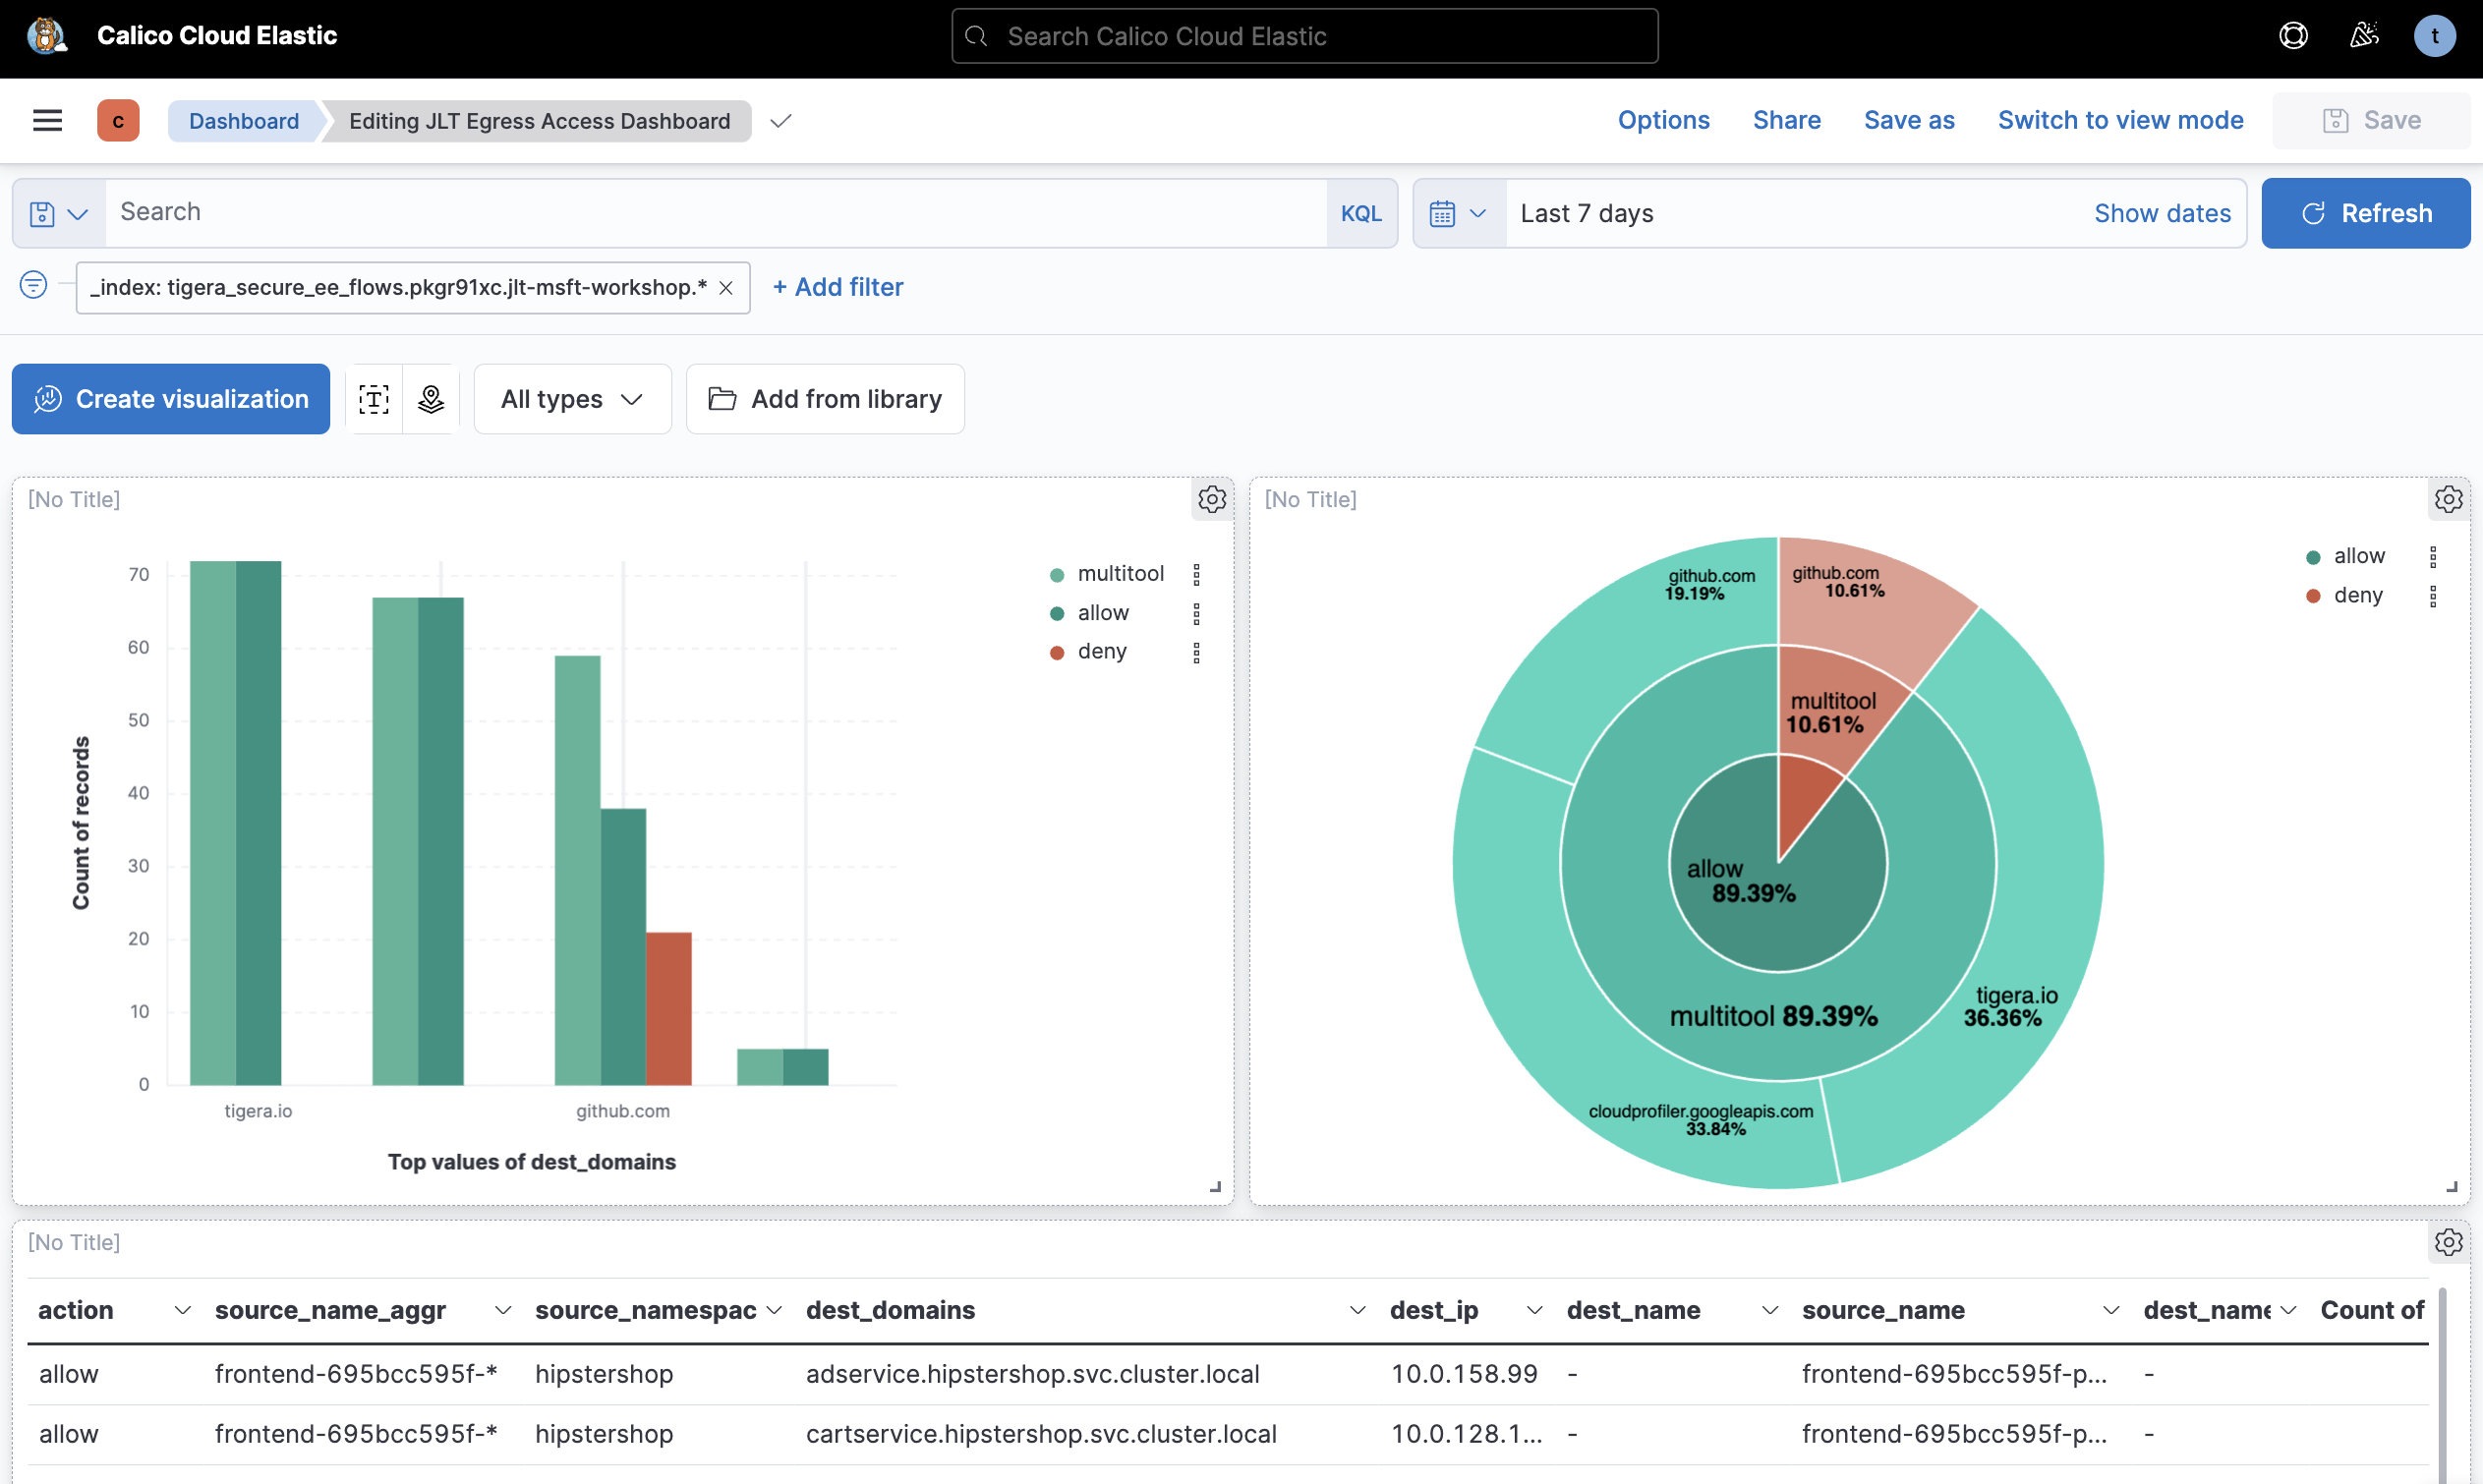
This example dashboard only includes egress traffic from a cluster. Anyone viewing this dashboard can create and validate egress access controls, or DNS policies, based on insights from dashboard.
Kibana logs
Different types of logs are categorized into indexes. All logs are enabled by default except L7 logs, which must be explicitly enabled.
Using logs in Kibana gives you more control over the queries and filters used to get information about traffic. For example, the built-in flow logs are restricted to show specific columns. In Kibana, logs can be filtered and columns chosen based on all of the metadata available.
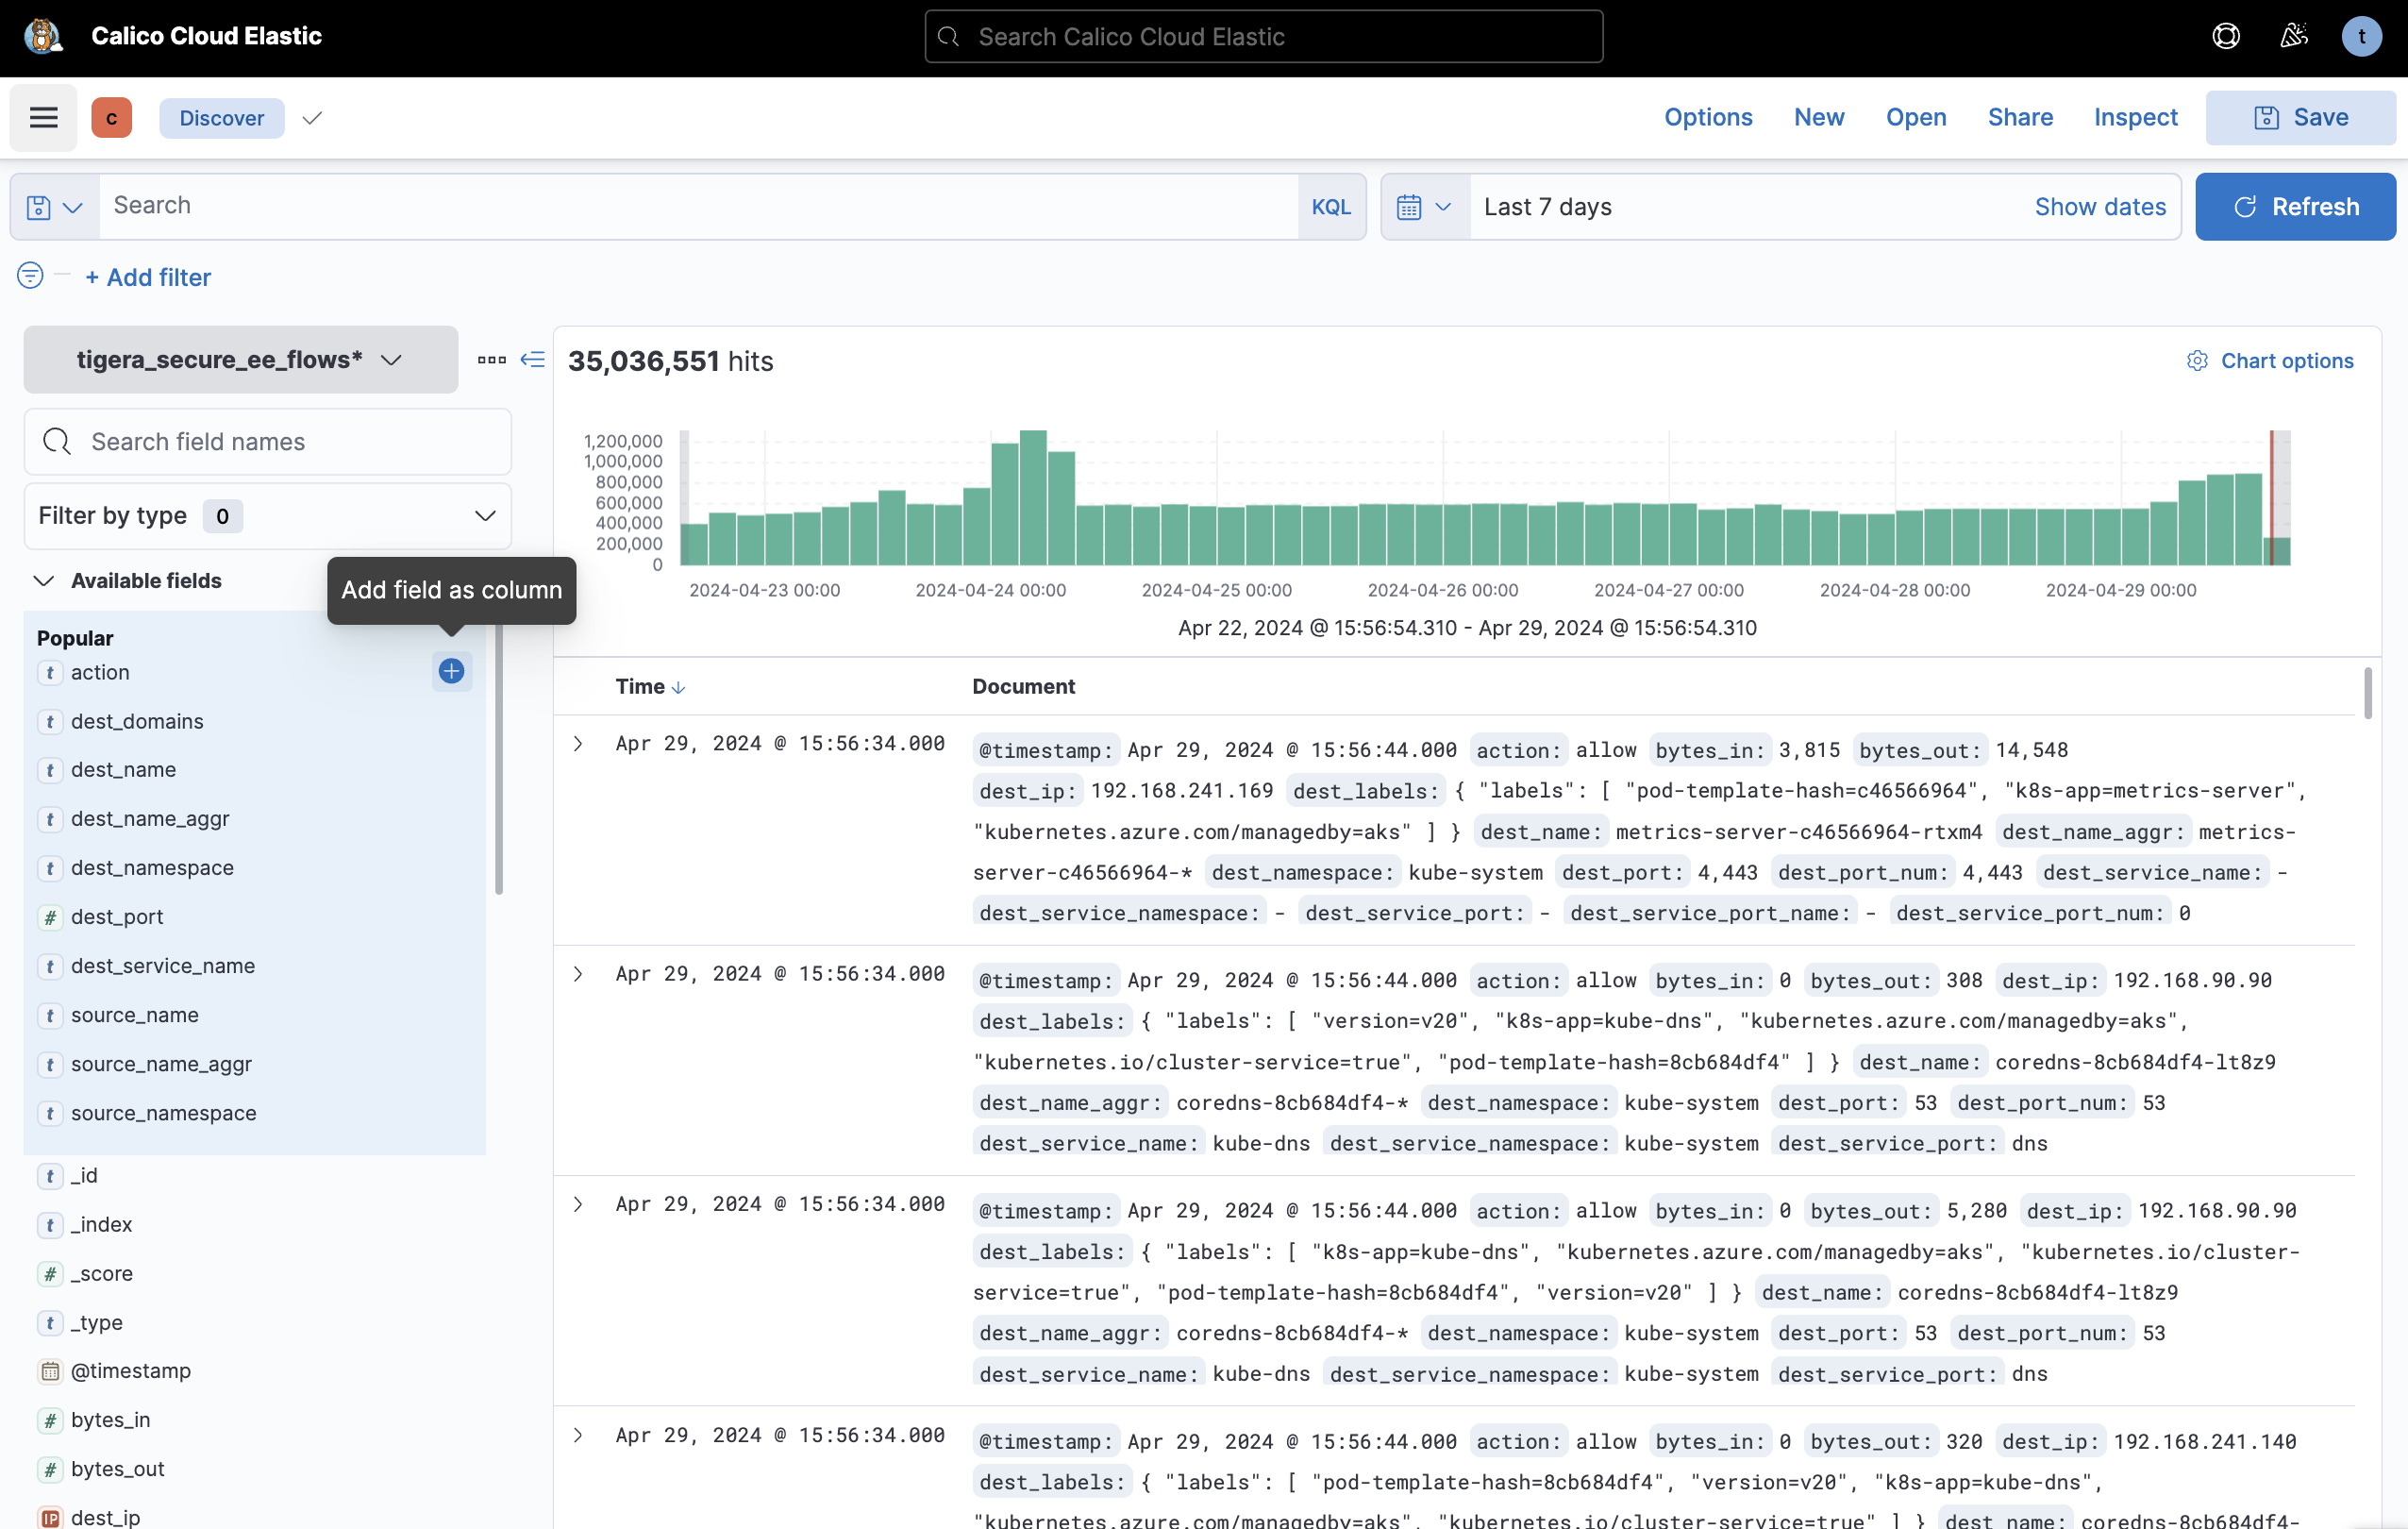
This data can also be represented in Kibana dashboards as a table to combine custom log views with graphical monitoring.
This suits users who are using logs to narrow focus for a specific use or complex troubleshooting.
Specific use cases
Calico Enterprise and Calico Cloud's observability features go beyond visualizing the internals of a cluster, and provide a place to highlight potential issues or security concerns, troubleshoot communication issues, and even identify flows that need to be secured, such as:
Each section has been grouped into a few different scenarios that outline how Calico Enterprise and Calico Cloud can help solve these use cases.
Network policies and flows
Identify denied flows
Flow logs can be used to identify flows that are either allowed or denied by policies. Each flow is reported twice, once by the source and once by the destination, so there are two different perspectives for each flow.
Denied flows can easily be identified in many places within Calico Enterprise or Calico Cloud:
- Dashboards: Unless the view has been customized, there is a policies widget on the built-in dashboard showing policies, which will show a count of policies that are denying traffic.
- Dynamic Service and Threat Graph: the Dynamic Service and Threat Graph flow lines will change to red or orange if flows are being denied.
- Flow Viz: Easily toggle the status view or filter to easily list or visualize denied flows (in red).
- Logs: Flow logs viewed through the Dynamic Service and Threat Graph and will automatically filter based on the current view, or create custom filters for denied traffic.
- Kibana: Dashboards or logs accessed through Kibana can be filtered with queries specifically targeting flows with
action : deny
Identify flows denied by a policy
Identifying flows denied by a policy is similar to identifying denied flows, but instead of taking a flow-first approach, this takes a policy-first approach. You may need to see all flows being impacted by a policy for analysis or to confirm the policy is working as expected.
- Policy Board: In the Policy Board you can now see flow logs filtered by policy when selecting a policy and looking at the flows.
- Logs: Flow logs viewed through the Dynamic Service and Threat Graph and will automatically filter based on the current view, or create custom filters for denied traffic.
- Kibana: Dashboards or logs accessed through Kibana can be filtered with queries specifically targeting policies with queries like:
policies:{all_policies: deny and all_policies: tenant-01-restrict}. This query would show all flows being denied by thetenant-01-restrictpolicy.
Cluster traffic
Inbound and outbound bytes
Visualizing inbound and outbound bytes may help identify whether your application is experiencing higher than normal load or whether there is malicious activity causing increased traffic.
- Dynamic Service and Threat Graph: Hovering over flow lines between objects in the Dynamic Service and Threat Graph brings up a dialog that reports the number of allowed or denied packets and bytes.
- Flow Viz: Flow Viz by default is a volumetric view of traffic that helps your identify which namespaces or services are generating the most traffic. The right-hand panel in Flow Viz also displays the CPS, PP, and BPS.
- Logs: Flow logs record the number of bytes in and bytes out for each flow.
- Kibana: Dashboards in Kibana have pie charts that show volumetric traffic by bytes in and out for source and destination namespaces. Dashboards can be filtered to provide more detailed information.
Identify flows with bytes_in : 0
Flows with bytes_in : 0 and action : allow indicate that an upstream firewall denied a flow, or the server is not responding to the connection.
This can be used to troubleshoot issues related to firewall policies outside of Kubernetes.
Typically, Calico Enterprise or Calico Cloud will show that the flow was allowed but the client or user will complain that the connection was not established.
This could be happening because:
- There is a firewall in front of the external service.
- The service is no longer live or active.
When this happens, Calico Enterprise or Calico Cloud will show bytes going out, but no bytes coming in.
- Logs: Flow logs record the number of bytes in and bytes out for each flow, so you can identify flows with 0 bytes in.
- Kibana: Dashboards and logs in Kibana show bytes in/out for flows, making it easy to find flows that are not being denied by network policies (ruling out issues with Calico) and have 0 bytes in.
See this shown in a Flow Log Dashboard.
Flow properties and metadata
Identify flows to and from specific processes
Within a pod there could be more than one container, and each container could have different processes initiating or receiving flows. Typically, identifying the port or container level might be easier, but identifying the specific process is harder. Calico uses eBPF probes to record this data and enrich flow logs with a process ID. All Calico products (Open Source, Enterprise or Cloud) support eBPF as a data plane.
This is useful for identifying a workload initiating communication with decommissioned services or services it shouldn't be communicating with. It can also be used to identify any communication related to a vulnerability, such as log4j.
- Logs: Flow logs contain process metadata such as process ID, name, and process arguments.
- Kibana: Dashboards and logs in Kibana can be queried using kql to search for flows with specific process ids, names or arguments. This will return all flows that match, helping to identify the source and destination of flows for those processes.
See an example using Kibana to filter and identify flows related to log4j communication.
Identify traffic to specific service ports
- Dynamic Service and Threat Graph: the Dynamic Service and Threat Graph flow lines will show (in the right-hand information panel) the protocols and ports when clicked on. This will automatically filter the Flow Logs for more insights.
- Logs: Flow logs include the destination port of a flow.
- Kibana: Dashboards or logs accessed through Kibana can be filtered to show each flow, which contains destination ports. It can also aggregate destination port information to show the destination ports and the number of flow records per port.
This makes it easy to identify which ports are being communicated to from within the cluster. You could, for example, identify all traffic communicating with a database, or identify SSH traffic. This helps you identify workloads communicating over particular service ports.
See how to identify traffic to specific ports in Kibana
Identify traffic to specific FQDNs
If workloads are communicating with external services where the IP address correlates with a DNS entry, Calico Enterprise and Calico Cloud can record the fully qualified domain name (FQDN) of that service. This helps you identify workloads that are communicating with public external services.
- Logs: Flow logs contain the FQDN.
The destination will show as
pub, and thedest_domainsfield will show the domain name based on a DNS lookup. - Kibana: The Kibana dashboards have a "unique-domains" widget that lists the top values of
dest_domainsfrom flow logs, with a record count. Clicking on a domain name in that widget will filter all flows that sent traffic to that FQDN.
See how to identify traffic to specific FQDNs in Kibana
Identify traffic to specific destination IPs
Identifying traffic to IP addresses within a cluster is unlikely due to the ephemeral and dynamic nature of services and workloads, but there may be a need to identify communication to IPs outside of the cluster. This could be a service within your organization or environment, public IP addresses or potentially malicious IP addresses.
- Logs: Flow logs contain the destination IP address.
- Kibana: The Kibana dashboards have a ‘unique destination IP' widget which lists the top values of
dest_ipfrom flow logs, with a record count. Clicking on an IP address creates a filter, and you can use that to filter flows that have been communicating with that IP address.
Watch an example of identifying traffic to specific destination IPs in Kibana.
Identify all egress connections from a workload
Egress connections from a workload could be internal services inside your environment, external or public services on the internet. Knowing what external services your workloads are communicating with may be useful to create DNS policies for your cluster or for validating that services are communicating with the correct, expected services.
- Dynamic Service and Threat Graph: the Dynamic Service and Threat Graph will show connections outside of the cluster with a globe-type icon, and will be named according to if it's public, private or a defined network set. Clicking on the icon or flow lines leading to it will filter the flow logs view within the Dynamic Service and Threat Graph.
- Logs: Flow logs viewed through the Dynamic Service and Threat Graph will automatically filter based on the current view, or create custom filters for denied traffic.
- Kibana: Dashboards in Kibana contain a widget that lists unique domains and this can be exported to CSV. Kibana also allows for advanced queries so the unique domains can be filtered down to a namespace or workload level.
This approach is similar to the Identify FQDN section, and can combined with other filters or widgets to identify service ports, and potentially highlight connections to insecure services (using 80 instead of 443, for example).
See how to identify all egress connections from a workload in Kibana.
DNS
DNS issues within a cluster can significantly impact an application's performance and reliability. This could be a result of misconfigurations, DNS infrastructure failures, or DNS infrastructure performance issues. These issues often manifest as application issues rather than DNS issues, leading to poor user experience and making troubleshooting and diagnostics difficult.
DNS infrastructure in Kubernetes interacts with upstream DNS servers for external domain lookups, which could impact your Kubernetes workloads. Some organizations may have complex DNS queries, matrix, multiple DNS servers, and go through several recursive loops before a client receives an IP address. This gets more complicated if there are multiple DNS zones or global load balancing between geolocated services that have their own servers. If any of those other servers are experiencing issues they could manifest as DNS issues impacting your workloads.
Calico Enterprise and Calico Cloud provides the following features to troubleshoot DNS issues:
- Dynamic Service and Threat Graph: the Dynamic Service and Threat Graph provides a graphical view of connectivity to kube-dns from different namespaces and workloads, and the interactive interface aids with troubleshooting, for example automatically filtering logs.
- DNS Logs: DNS logs are standard and include DNS queries within the cluster from pods to kube-dns to external DNS servers. Each of these logs contains a variety of metadata. For every DNS transaction you can identify the initiator, IP address, labels, namespace, DNS domain queried, DNS response code, and more.
- DNS Dashboard: The DNS dashboard provides an overview of a cluster's DNS health and statistics, which at a high level can identify any issues.
Using these observability features can help troubleshoot:
- denied DNS traffic (possibly as a result of misconfigured policies)
- SERVFAIL errors, where DNS servers fail to respond to queries, which might be due to DNS server outages or misconfigurations
- NXDOMAIN issues, where an resource record is missing for a domain, which could be due to a misconfigured application, incorrect or decommissioned domain
To see exactly how to troubleshoot DNS issues in Calico Enterprise or Calico Cloud, watch the Introduction to DNS Observability Challenges video series.
TCP
Calico Enterprise and Calico Cloud provides the following features to troubleshoot TCP issues:
- TCP Dashboard: Kibana has a DNS dashboard that shows minimum round trip time, maximum round trip time, TCP retransmissions and TCP packet drops, throughput (bytes and packets in/out), for each node, as well as detailed logs.
The dashboard can be filtered to show TCP statistics for a specific application, and each node can be analyzed for differences in performance between nodes, retransmissions, or packet losses. Differences in performance between nodes may signify an unhealthy node. Using filters can help narrow down the scope of performance issues and see what applications or workloads might be impacted.
The TCP performance dashboard is a starting point for identifying anomalies and getting an overview of TCP performance. Use filters to see statistics for nodes, applications, ports, destinations and so on.
Watch how Calico Enterprise or Calico Cloud can enable you to troubleshoot TCP videos in this TCP video series.