Manage alerts
Big picture
Manage alerts and alert events for Calico Enterprise features.
Value
You can configure alerts for many Calico Enterprise features. Alerts are critical to teams for different reasons, for example:
- Visibility and troubleshooting - alerts may indicate infrastructure problems, application bugs, or performance degradation
- Security - alerts on suspicious traffic or workload behavior may indicate a compromise or malicious actor
You can manage alerts and alert events in the web console, or using the CLI. Calico Enterprise also provides alert templates for common tasks that you can rename and edit to suit your own needs.
Before you begin
Recommended
We recommend turning down the aggregation level for flow logs to ensure that you see pod-specific results. Calico Enterprise aggregates flow logs over the external IPs for allowed traffic, and alert events will not provide pod-specific results (unless the traffic is denied by policy).
To turn down aggregation on flow logs, go to FelixConfiguration and set the field, flowLogsFileAggregationKindForAllowed to 1.
How to
Manage alerts in the web console
You can view alert events in the web console in several places: the Alerts page, Service Graph, and the Kibana dashboard.
Click Activity, Alerts to follow along.
Alerts page
The Alerts page lists alert events that are generated by alerts that you’ve configured. (A list of Alerts can be found by clicking the Alert configuration icon).
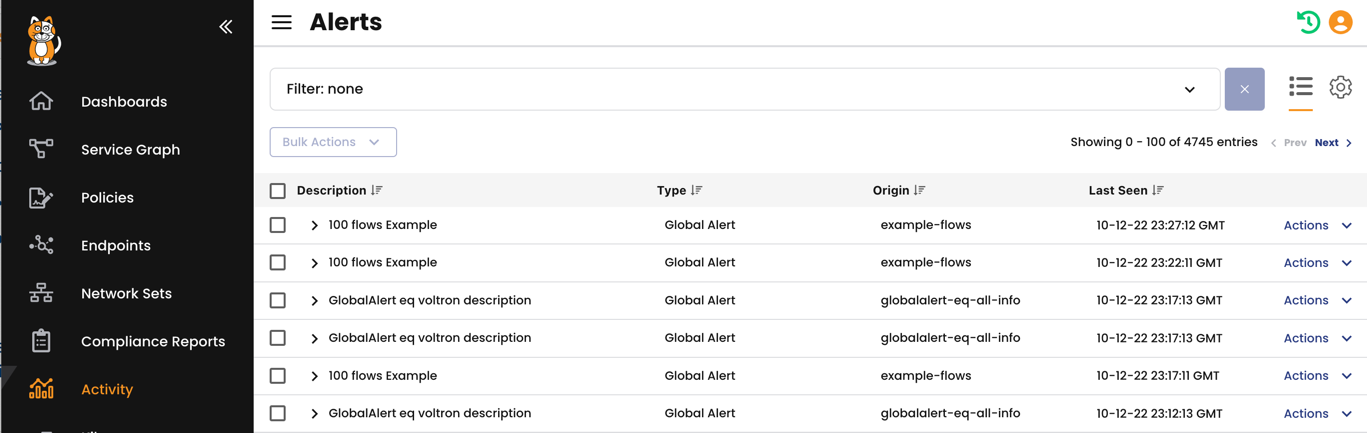
You can create alerts for many Calico Enterprise features. Although the following list of features is not exhaustive and will grow, you get a sense of the range of alerts that can be displayed on this page.
- Calico Enterprise logs from Elasticsearch (flow, dns, audit, bgp, L7)
- Deep packet inspection (DPI)
- Threat defense (suspicious IPs, suspicious domains)
- Web Application Firewall (WAF)
Note the following:
-
The alert event list will be empty until you configure alerts for a feature
-
You can dismiss alert events from view using the checkboxes or bulk action
-
The list may contain alert events that are identical or nearly identical. For nearly identical events, you can see differences in the
recordfield when you expand the event. -
Because alert events share the same interface, fields that do not apply to the alert are noted by “N/A”
-
You can filter alert events by Type.
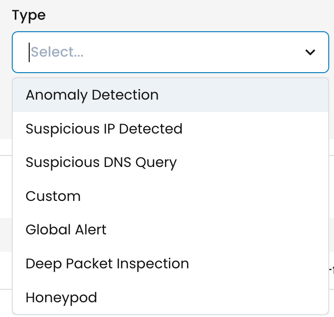
Note these types:
- Custom - filters legacy global alert events that were created before v3.12
- Global Alert - includes alerts for Calico Enterprise Elasticsearch logs (audit, dns, flow, L7, WAF)
Add/edit/delete alerts
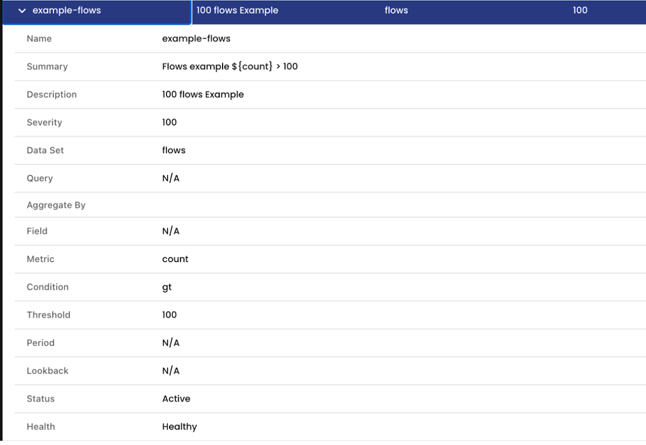
To manage alerts, click the Alerts Configuration icon.
The following alert is an example of a global alert in the list view. This sample alert generates alert events when there are 100 flows in the cluster in the last 5 mins. (The YAML version of this alert is shown in the section on using the CLI.)
To create a new alert, click the New drop-down menu, and select Blank.
Global alerts use a domain-specific query language to select records from a data set to use in the alert. You can also select/omit specific namespaces.
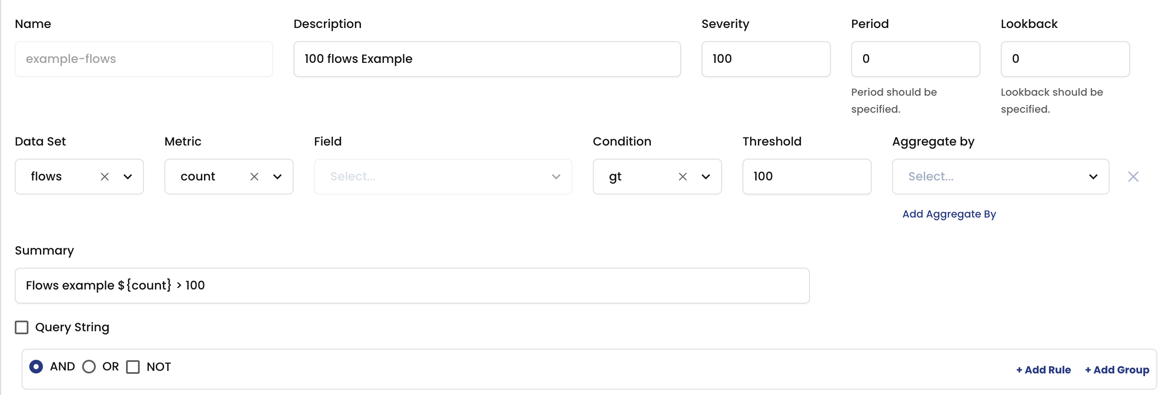
For help with fields on this page, see GlobalAlert.
Alert templates
From the New drop-down menu, select Template.
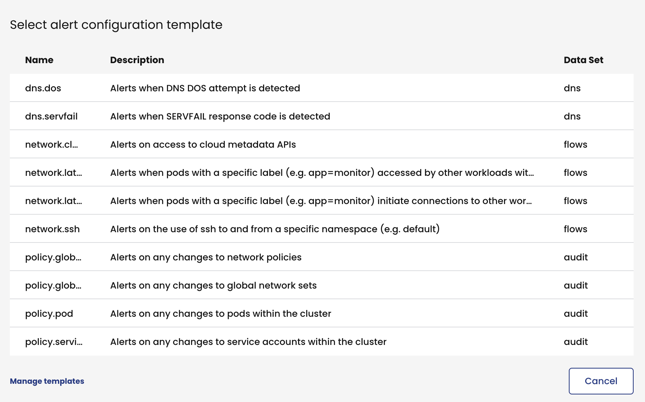
The template list contains alerts for common tasks created by Calico Enterprise. With templates you can:
- Update and rename an existing template
- Create a new template from scratch
- Create a new alert and save it as a template
Manage alerts using CLI
This section provides examples of how to create and delete global alerts using kubectl and YAML files.
Create a global alert
-
Create a YAML file with one or more alerts.
-
Apply the alert to your cluster.
kubectl apply -f <your_alert_filename> -
Wait until the alert runs and check the status.
kubectl get globalalert <your_alert_name> -o yaml -
In the web console, go to the Alerts page to view alert events.
Examples
The following alert generates alert events when there are 100 flows in the cluster in the last 5 mins.
apiVersion: projectcalico.org/v3
kind: GlobalAlert
metadata:
  name: example-flows
spec:
  description: '100 flows Example'
  summary: 'Flows example ${count} > 100'
  severity: 100
  dataSet: flows
  metric: count
  condition: gt
  threshold: 100
The following alert generates alert events when there is ssh traffic in the default namespace.
apiVersion: projectcalico.org/v3
kind: GlobalAlert
metadata:
  name: network.ssh
spec:
  description: 'ssh flows to default namespace'
  summary: '[flows] ssh flow in default namespace detected from ${source_namespace}/${source_name_aggr}'
  severity: 100
  period: 10m
  lookback: 10m
  dataSet: flows
  query: proto='tcp' AND action='allow' AND dest_port='22' AND (source_namespace='default' OR dest_namespace='default') AND reporter=src
  aggregateBy: [source_namespace, source_name_aggr]
  field: num_flows
  metric: sum
  condition: gt
  threshold: 0
The following alert generates alert events when Calico Enterprise globalnetworksets are modified.
apiVersion: projectcalico.org/v3
kind: GlobalAlert
metadata:
  name: policy.globalnetworkset
spec:
  description: 'Changed globalnetworkset'
  summary: '[audit] [privileged access] change detected for ${objectRef.resource} ${objectRef.name}'
  severity: 100
  period: 10m
  lookback: 10m
  dataSet: audit
  query: (verb=create OR verb=update OR verb=delete OR verb=patch) AND "objectRef.resource"=globalnetworksets
  aggregateBy: [objectRef.resource, objectRef.name]
  metric: count
  condition: gt
  threshold: 0
The following alert generates alert events for all flow from processes in the data set.
apiVersion: projectcalico.org/v3
kind: GlobalAlert
metadata:
  name: example-process-set-embedded
spec:
  description: Generate alerts for all flows from processes in the set
  summary: Generate alerts for all flows from processes in the set
  severity: 100
  dataSet: flows
  query: process_name IN {"python?", "*checkoutservice"}
The following example generates alert events for DNS lookups that are not in the allowed domain set. Because this set can be potentially large, a variable is used in the query string and is referenced in the substitutions list.
apiVersion: projectcalico.org/v3
kind: GlobalAlert
metadata:
  name: example-domain-set-variable
spec:
  description: Generate alerts for all DNS lookups not in the domain set
  summary: Generate alerts for all DNS lookups not in the domain set with variable
  severity: 100
  dataSet: dns
  query: qname NOTIN ${domains}
  substitutions:
    - name: domains
      values:
        - '*cluster.local'
        - '?.mydomain.com'
Delete a global alert
To delete a global alert and stop all alert event generation, use the following command.
kubectl delete globalalert <global-alert-name>
Additional resources
- GlobalAlert and templates
- Alerts for Deep packet inspection
- Alerts for suspicious IPs
- Alerts for suspicious domains
- Alerts for Web Application Firewall