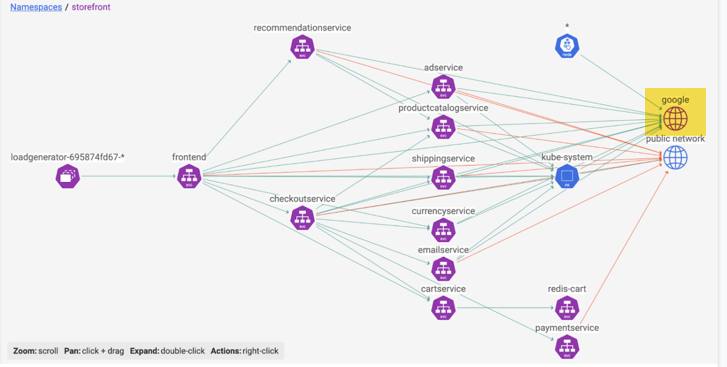
Network visualization
From the left navbar, select Service Graph, Default
Service Graph offers tools to visualize and investigate network communications in the cluster. To better understand how Service Graph works, here is the list of core features and components.
Service Graph features and components
Namespaces
Namespaces are the default view in Service Graph.
When you click on a namespace to expand the top right panel <<, you see detailed information about the traffic to / from
namespaces as well as list of services that belong to the selected namespace. To see service-to-service communications within
the namespace, double-click on the namespace node.
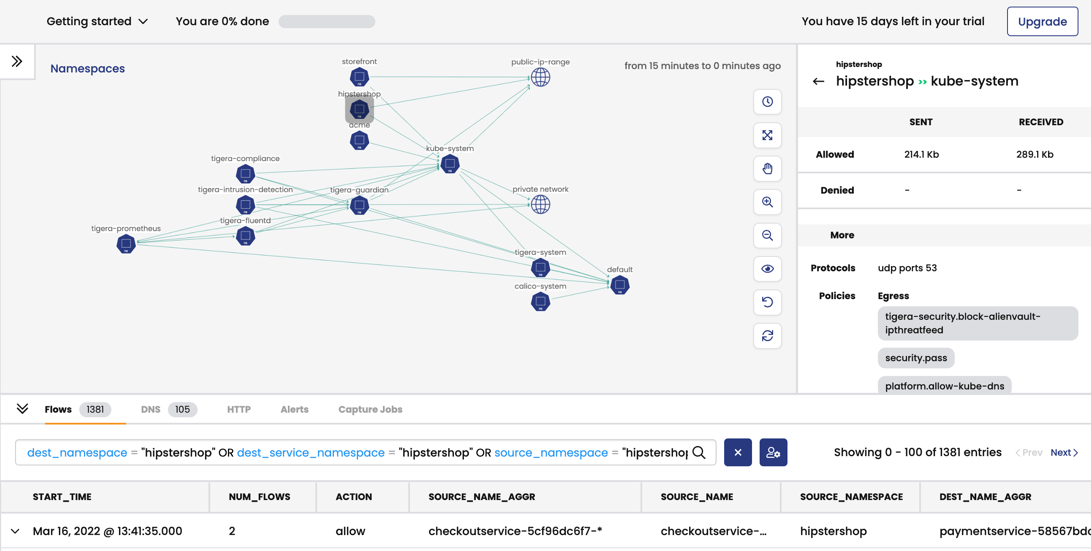
Nodes and edges
Lines going to/from nodes are called edges. When you click on a node or edge, the right panel shows details, and the associated flow logs are automatically filtered in the bottom panel.

Layers
Layers allow you to create meaningful groupings of resources so you can easily hide and show them on the graph. For example, you can group resources for different platform infrastructure types in your cluster like networking, storage, and logging.
Click the panel on the left (
>>) by the Namespaces breadcrumb, and then expand the Tigera components layer.
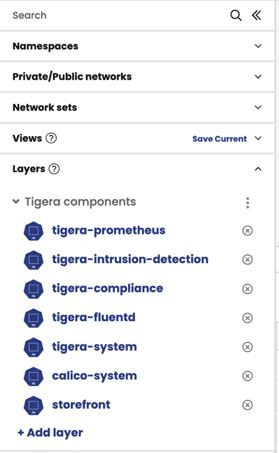
The Tigera components layer contains namespaces for Calico Enterprise networking components, and is a view of interest to Dev/Ops.
Click the vertical ellipses and select, Hide layer. Notice that only the business application namespaces remain visible in the graph.
To make this layer less visible, select Restore layer and click De-emphasize layer.
Service groups
Service group is an abstraction mechanism for grouping services in a single node in the namespace view. Services that pass traffic to the same destination are grouped within a service group.
If services within the service group belong to different namespaces the name of the node in namespace view is "*", otherwise the node displays the service group name, which is a string that combines all the unique service names.
If you double-click on the service group, you can see details of the services, endpoints, and the network communication links (edges) between them. Be aware that services and the backing endpoints could belong to different namespaces.
Here is an examples showing how services and endpoints are grouped under service groups. Note that the example is created with synthetic traffic data to showcase the service group feature and do not have any other value.
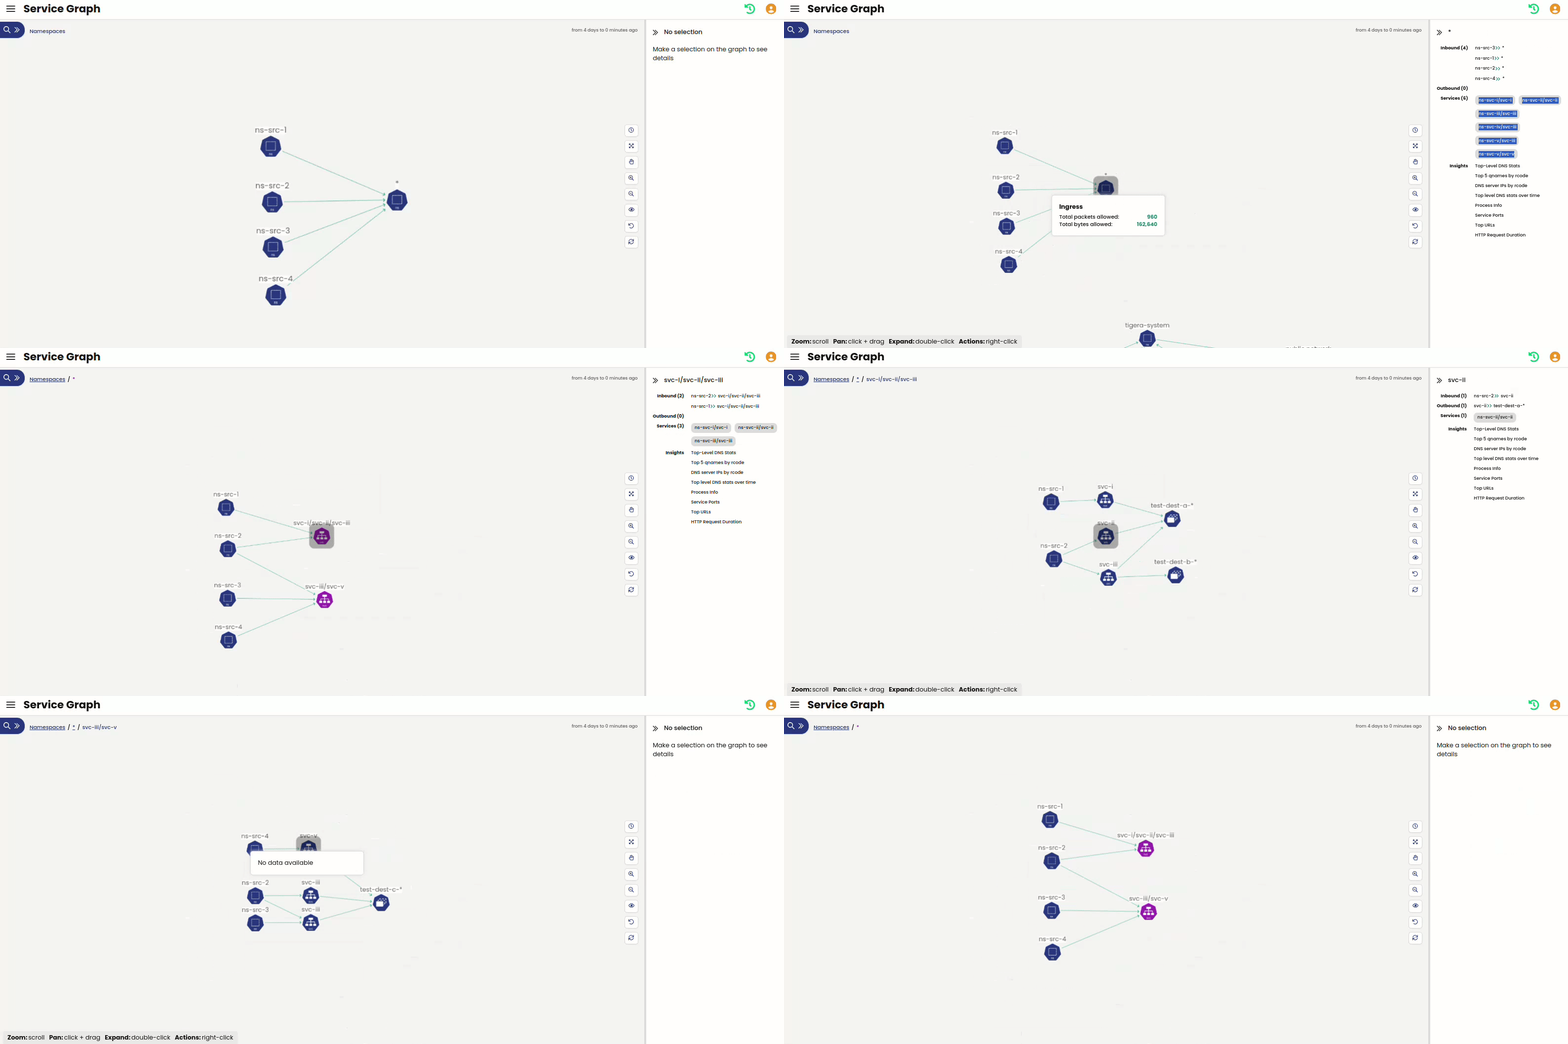
The image shows Service Graph in namespace view containing a node, "*", which represents not a namespace but an aggregation of service groups from different namespaces.
Logs, alerts, and capture jobs
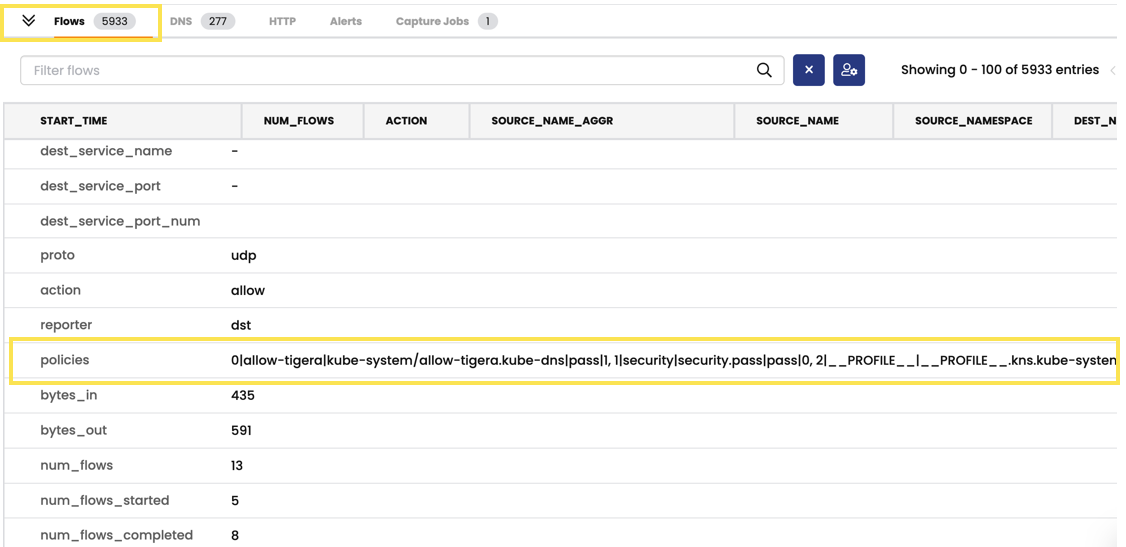
The panel at the bottom below the graph provides tools for troubleshooting connectivity and performance issues. Logs (Flows, DNS, and HTTP) are the foundation of security and observability in Calico Enterprise. When you select a node or edge in the graph, logs are filtered for the node or service. For example, here is a flow log with details including how the policies were processed in tiers.
Alerts
For convenience, the Alerts tab duplicates the alerts you have enabled in the Alerts tab in the left navbar. By default, alerts are not enabled.
Capture jobs
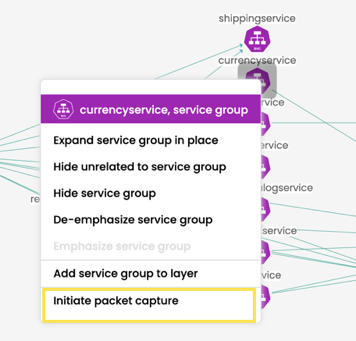
Service Graph integrates a packet feature for capturing traffic for a specific namespace, service, replica set, daemonset, statefulset, or pod. You can then download capture files to your favorite visualization tool like Wireshark.
Right-click on any endpoint to start or schedule a capture.
Flow Visualizations
From the left navbar, select Service Graph, Flow Visualizations.
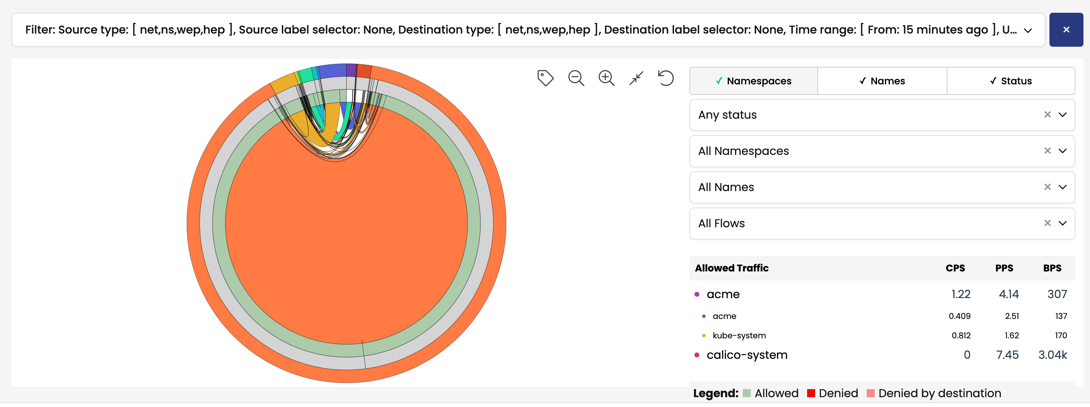
Flow Visualizer (also called, "FlowViz") is a Calico Enterprise tool for drilling down into network traffic within the cluster to troubleshoot issues. The most common use of Flow Visualizer is to drill down and pinpoint which policies are allowing and denying traffic between services.
Visualize traffic to and from a cluster
With Service Graph, you know the value of seeing pod-to-pod traffic within your cluster. But what about traffic external to your cluster? To learn how to visualize traffic to and from a cluster, see Get started with network sets.
