Dashboards
Dashboards help you see what's going on in your cluster. See how your cluster is performing and visualize your system's log data.
About dashboards
Calico Cloud provides a set of dashboards to help you understand the activity in your cluster. Each dashboard is made up of graphs, charts, and diagrams that visually represent the data in your logs.
To view your dashboards, sign in to the web console and click the Dashboards icon.
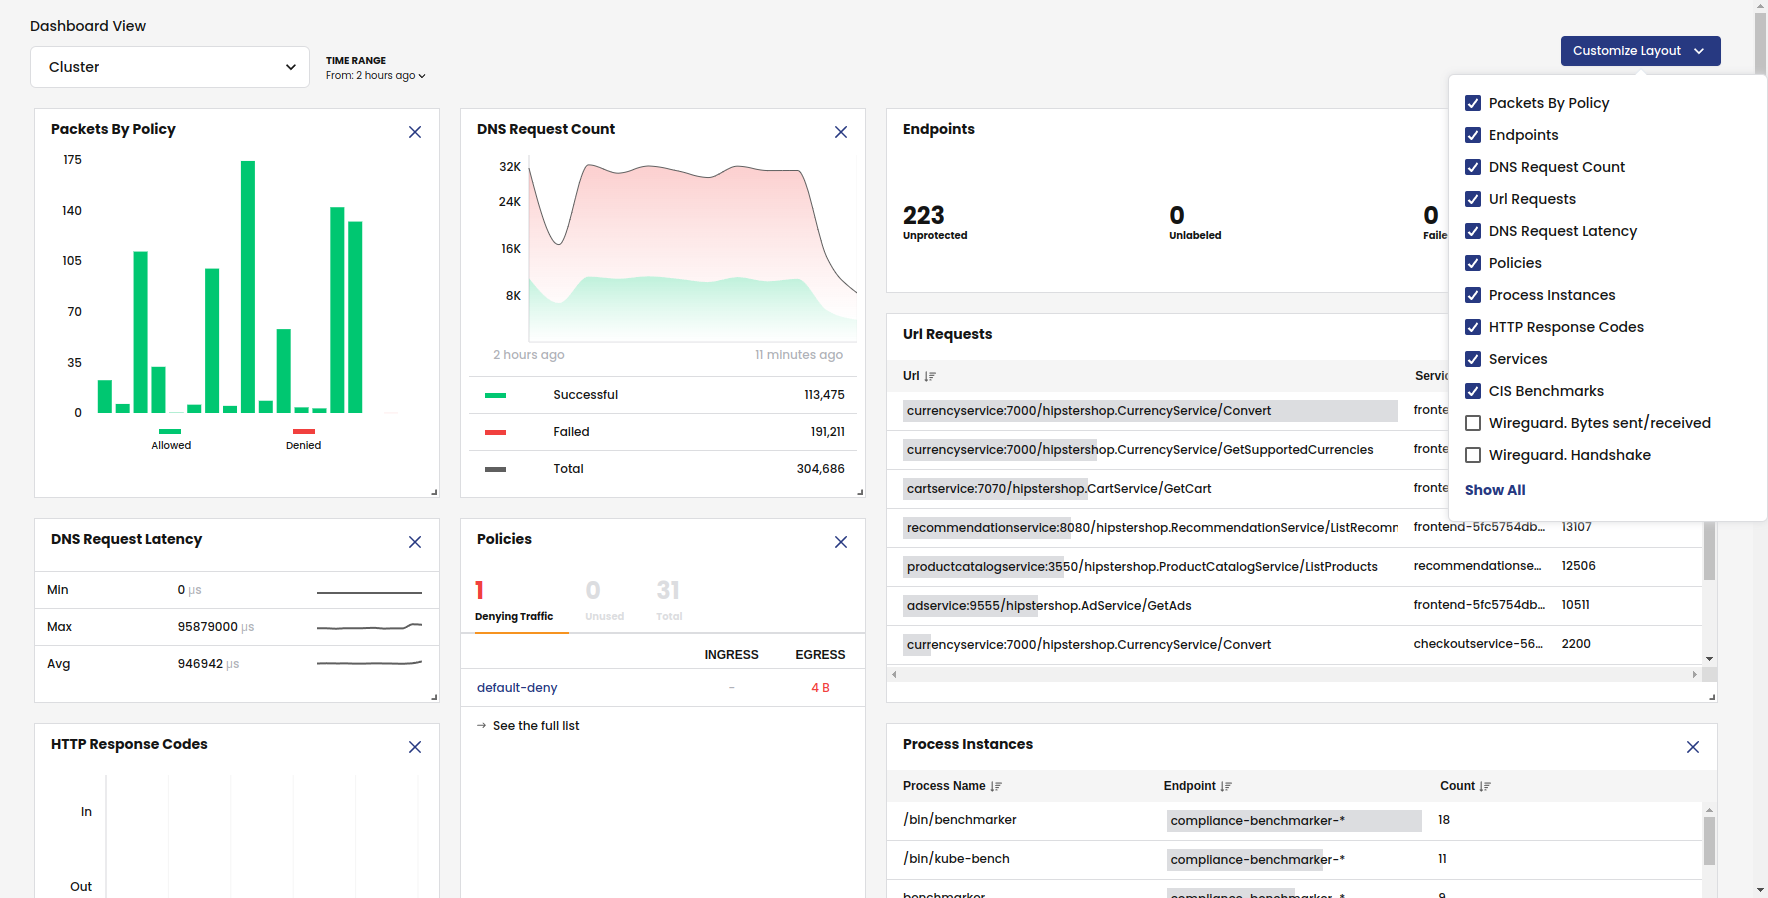
You can also create your own arrangement by creating a custom dashboard. With a custom dashboard, you can combine and arrange cards from any of the other dashboards.
Creating custom dashboards is limited to users with Owner, Admin, or Dashboards Admin permissions.
Role access to dashboards
The following user roles have access to all information in an organization's dashboards:
- Owner
- Admin
- Dashboards Admin
- Devops
- Security
- Viewer
Users must be assigned one of the standard roles above, or a custom role with dashboard permissions, to access dashboards. Administrators can limit dashboard access for custom roles, for example to specific clusters or namespaces in a cluster.
Cluster Health
The Cluster Health dashboard provides a birds-eye view of cluster activity.
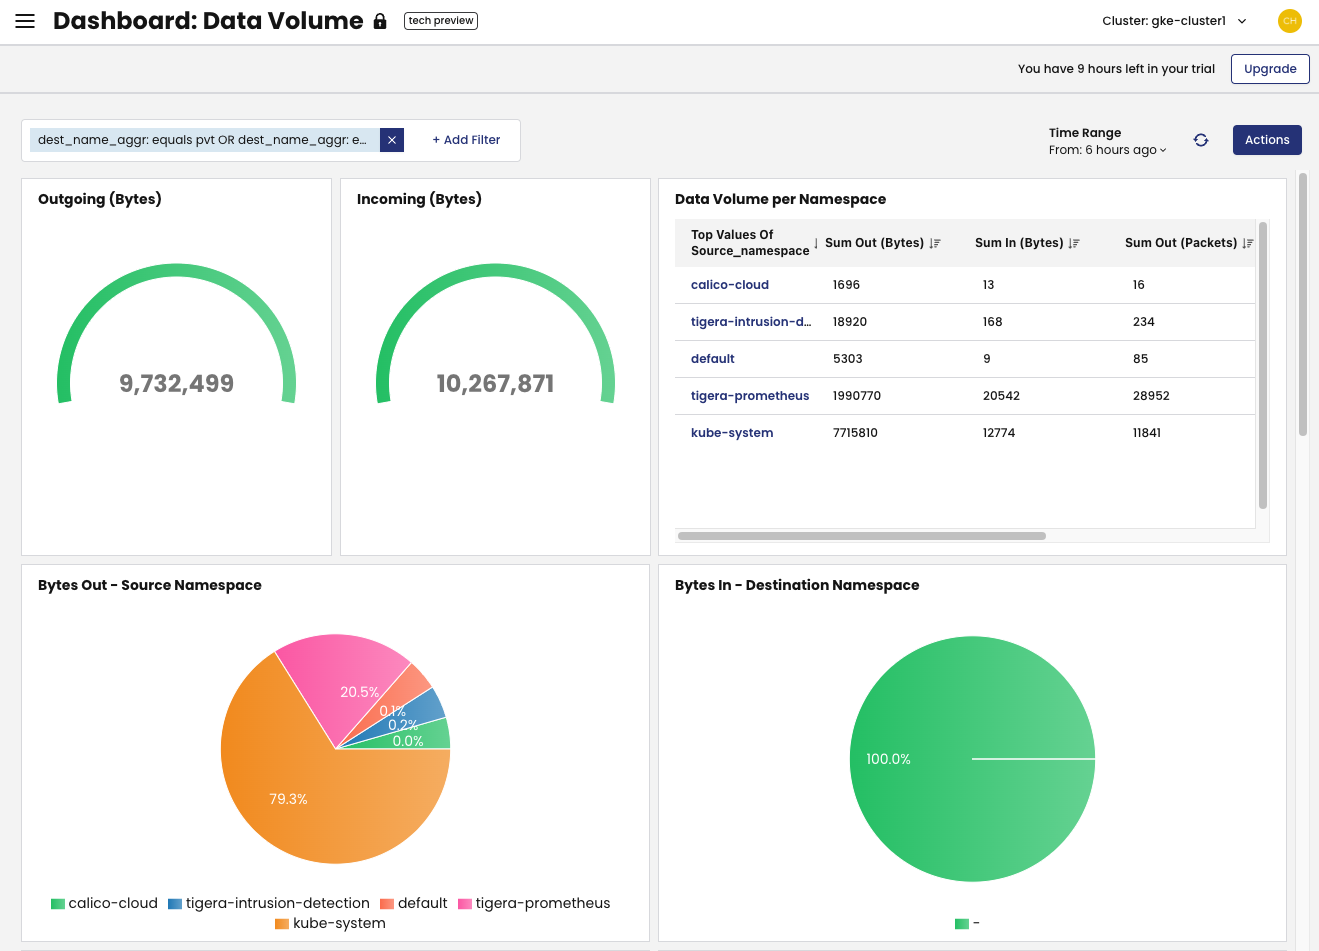
Traffic Volume
The Traffic Volume dashboard provides a high-level view of traffic in your cluster.
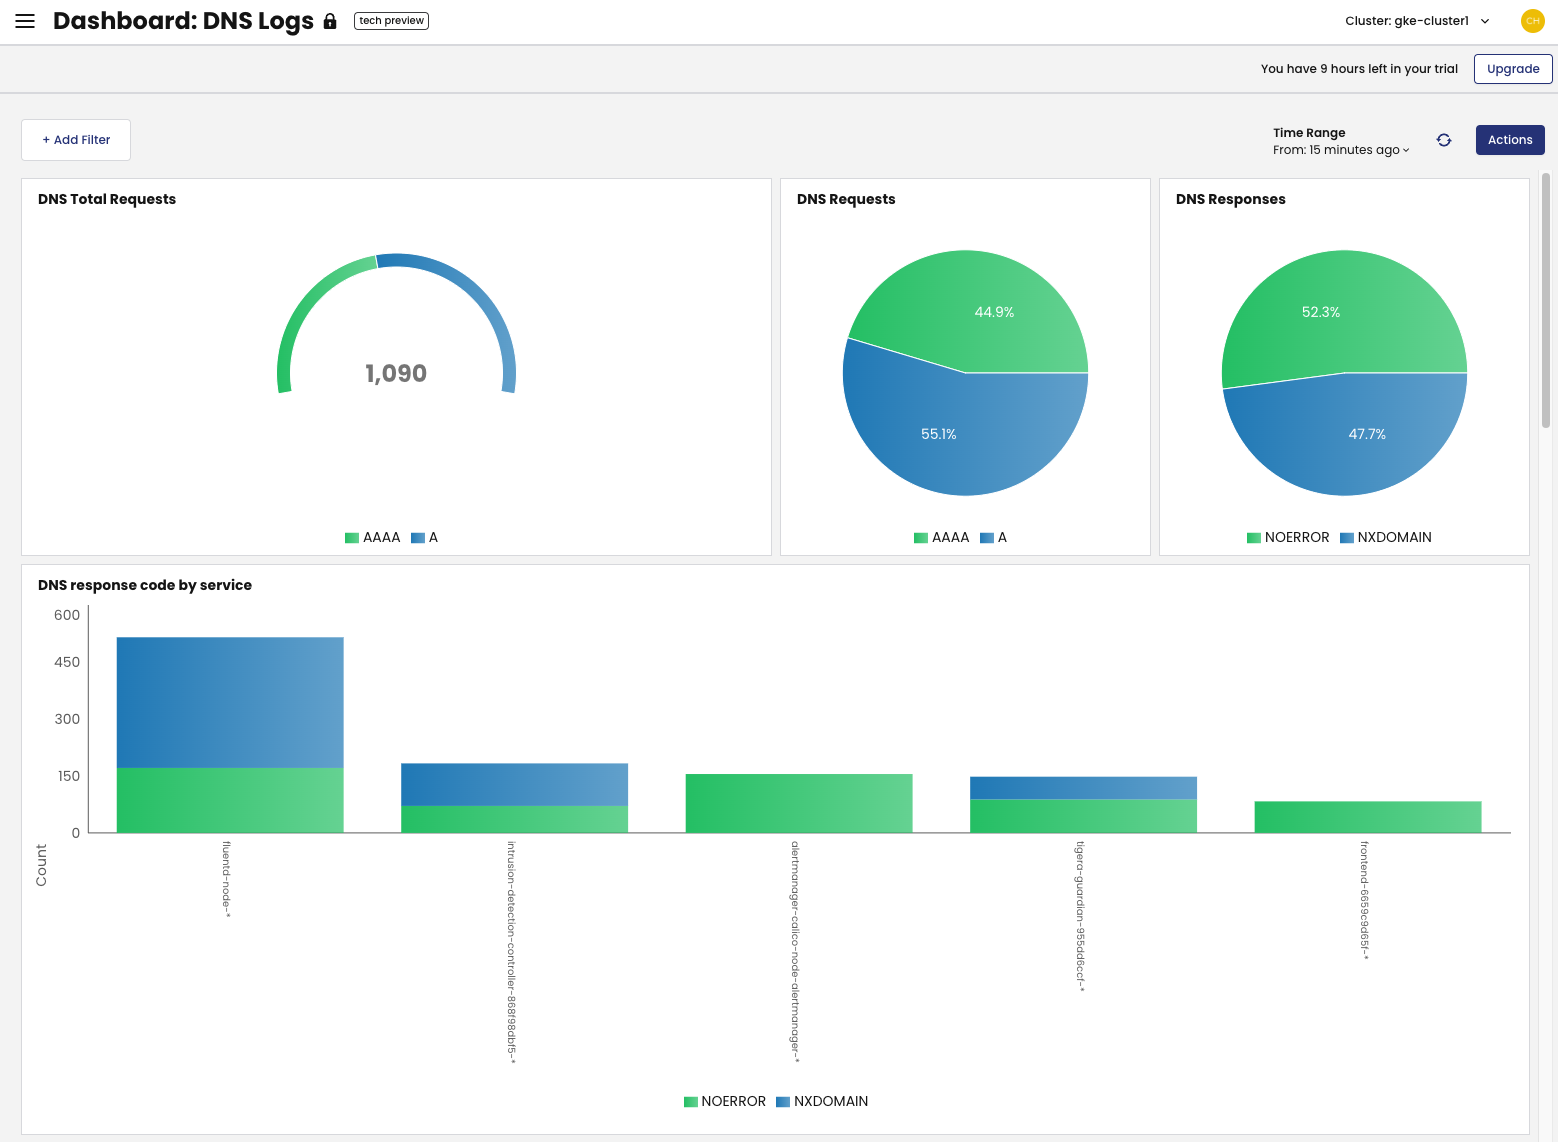
DNS Logs
The DNS Logs dashboard summarizes DNS data and logs into metrics, providing high-level information on the types of DNS lookups made, responses, and overall DNS performance.
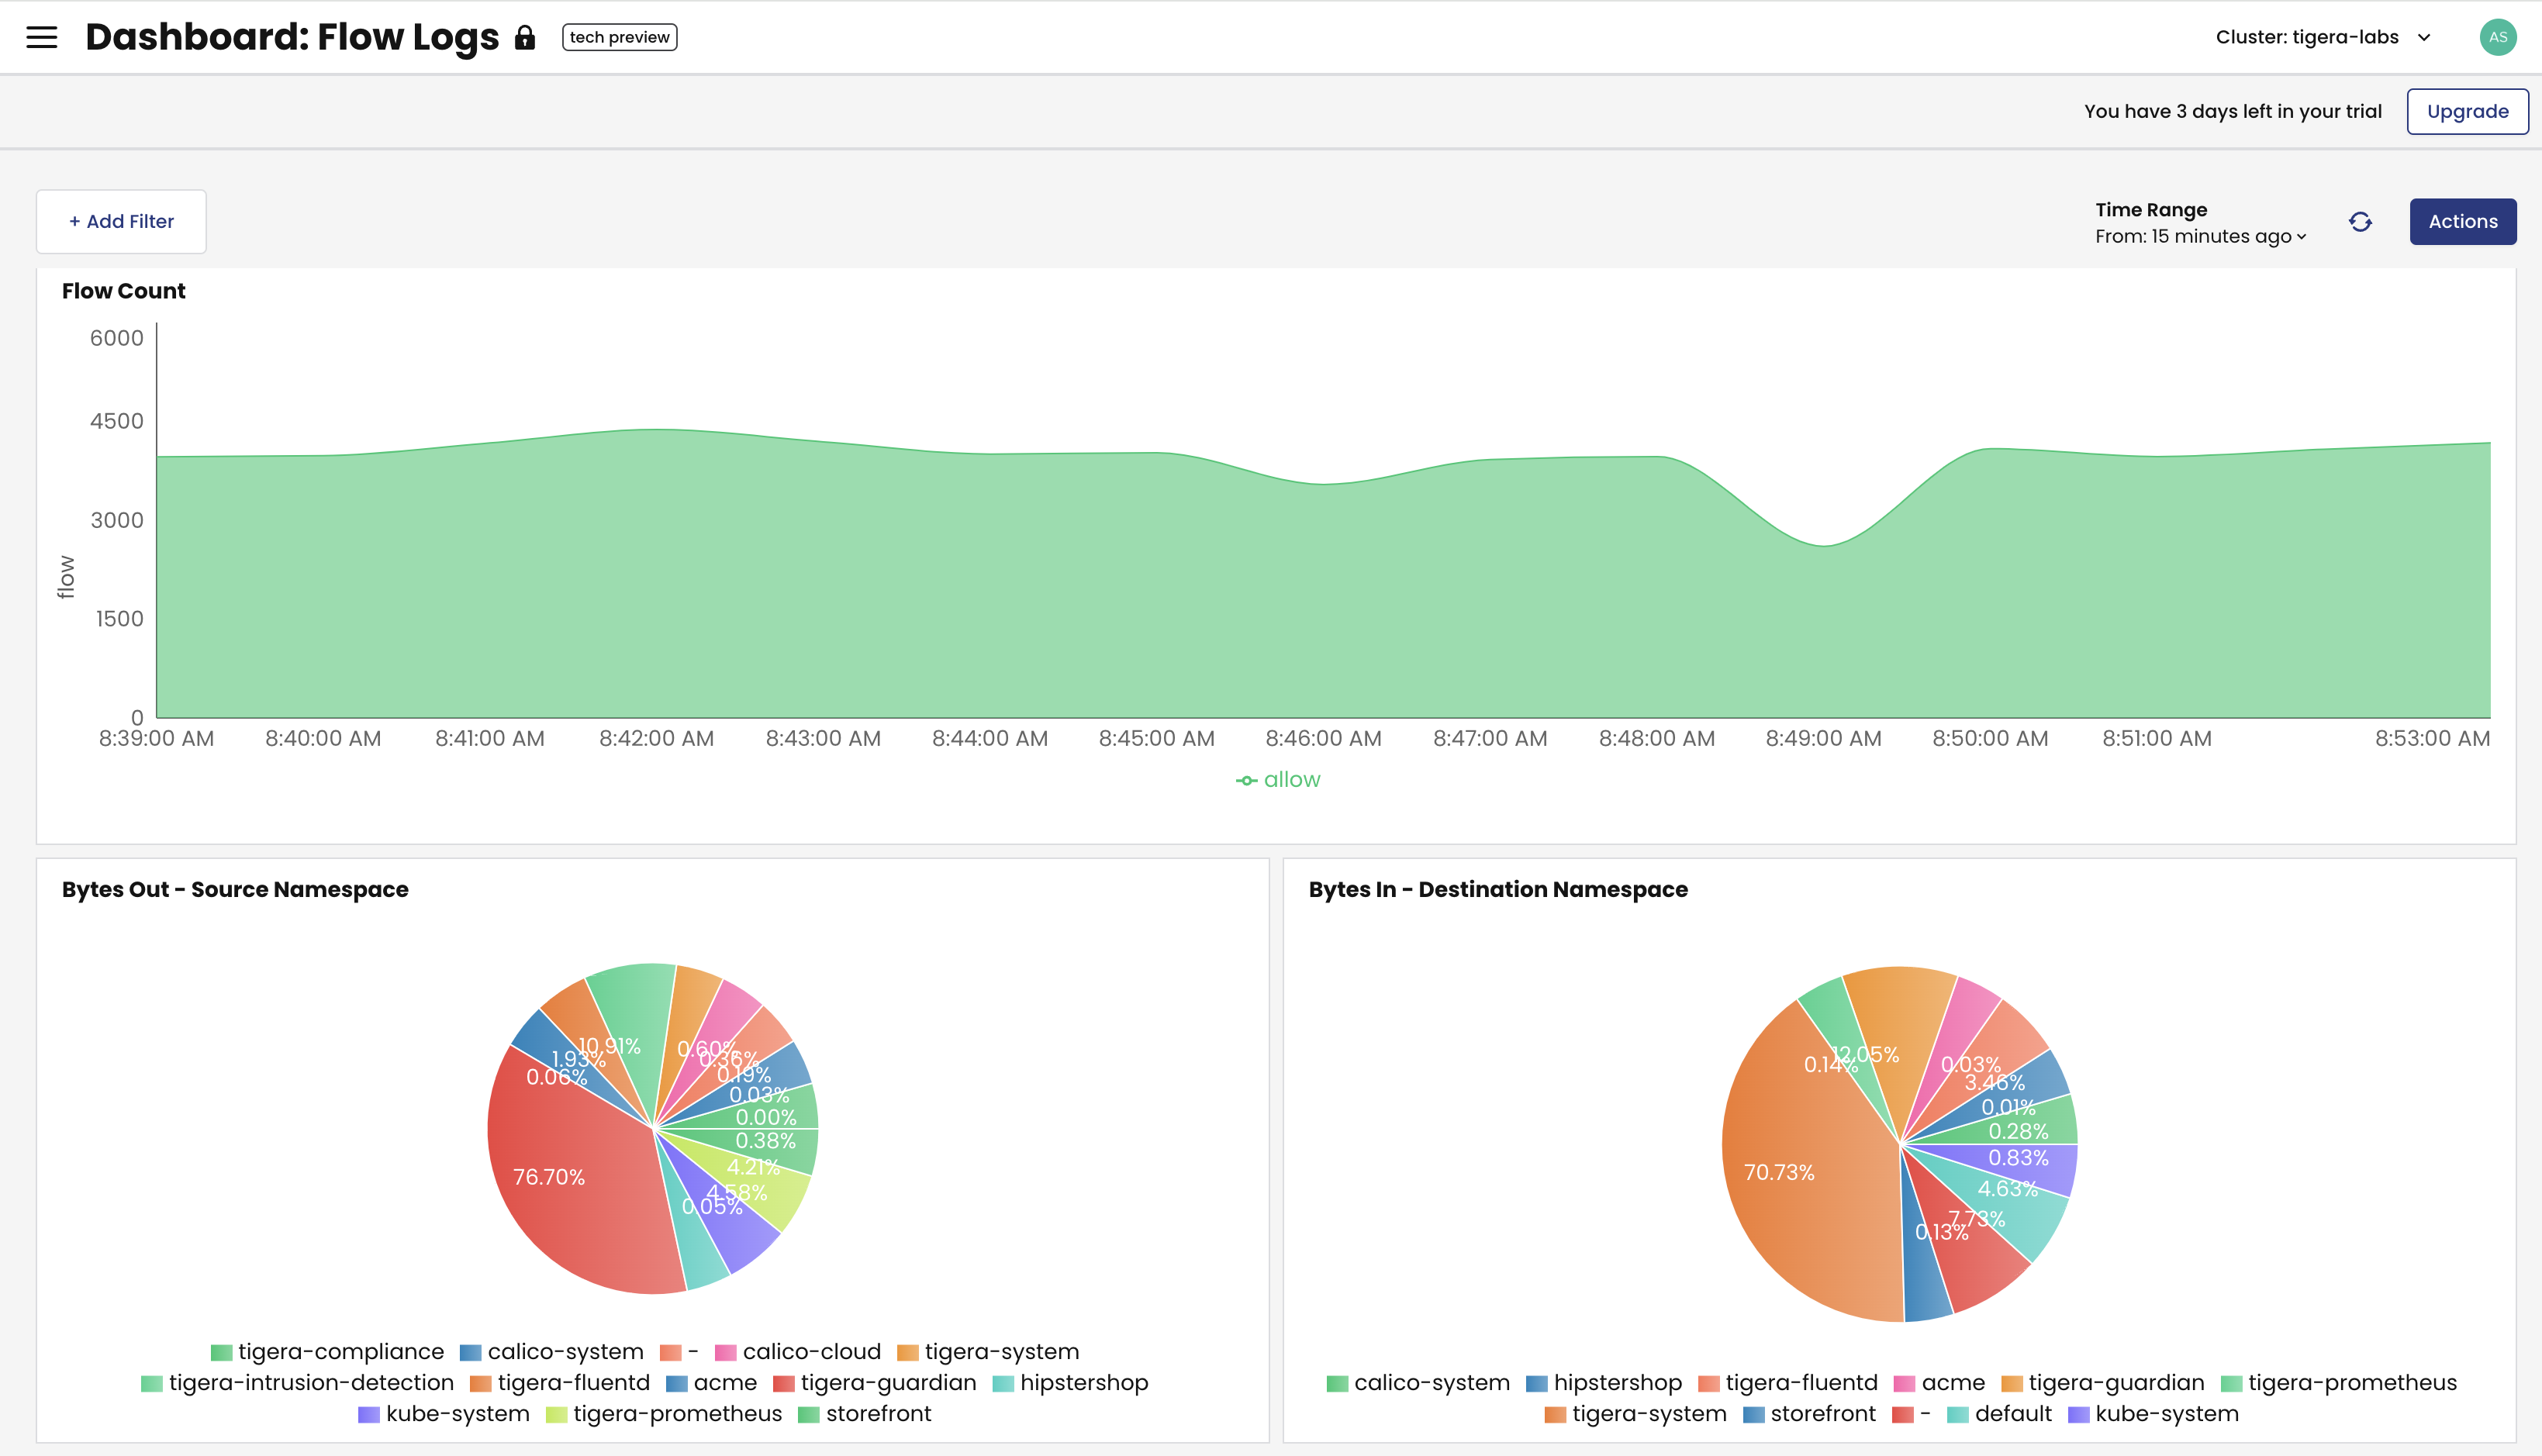
Flow Logs
The Flow Logs dashboard gives you an overview of how packets are being sent and received by all the pods in your cluster. Seeing this data helps you spot unusual flow activity, which may indicate a compromise.
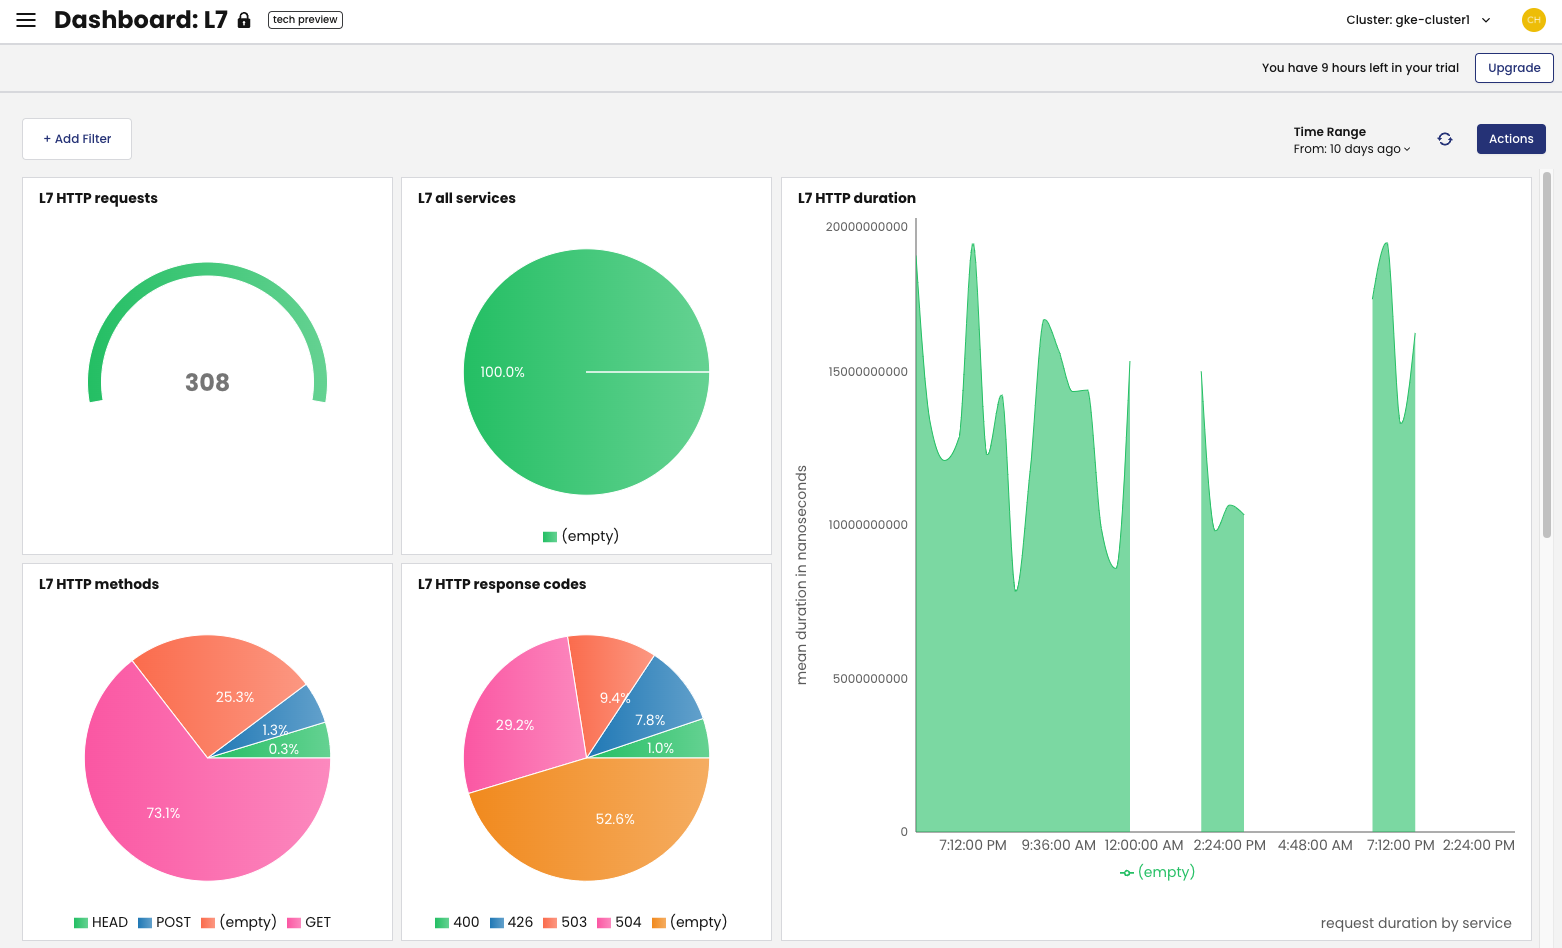
HTTP Traffic
The HTTP Traffic dashboard provides application performance metrics for in-scope Kubernetes services. The data can assist service owners and platform personnel in assessing the health of cluster workloads without the need for a full service mesh. L7 logs are not enabled by default, and must be configured.
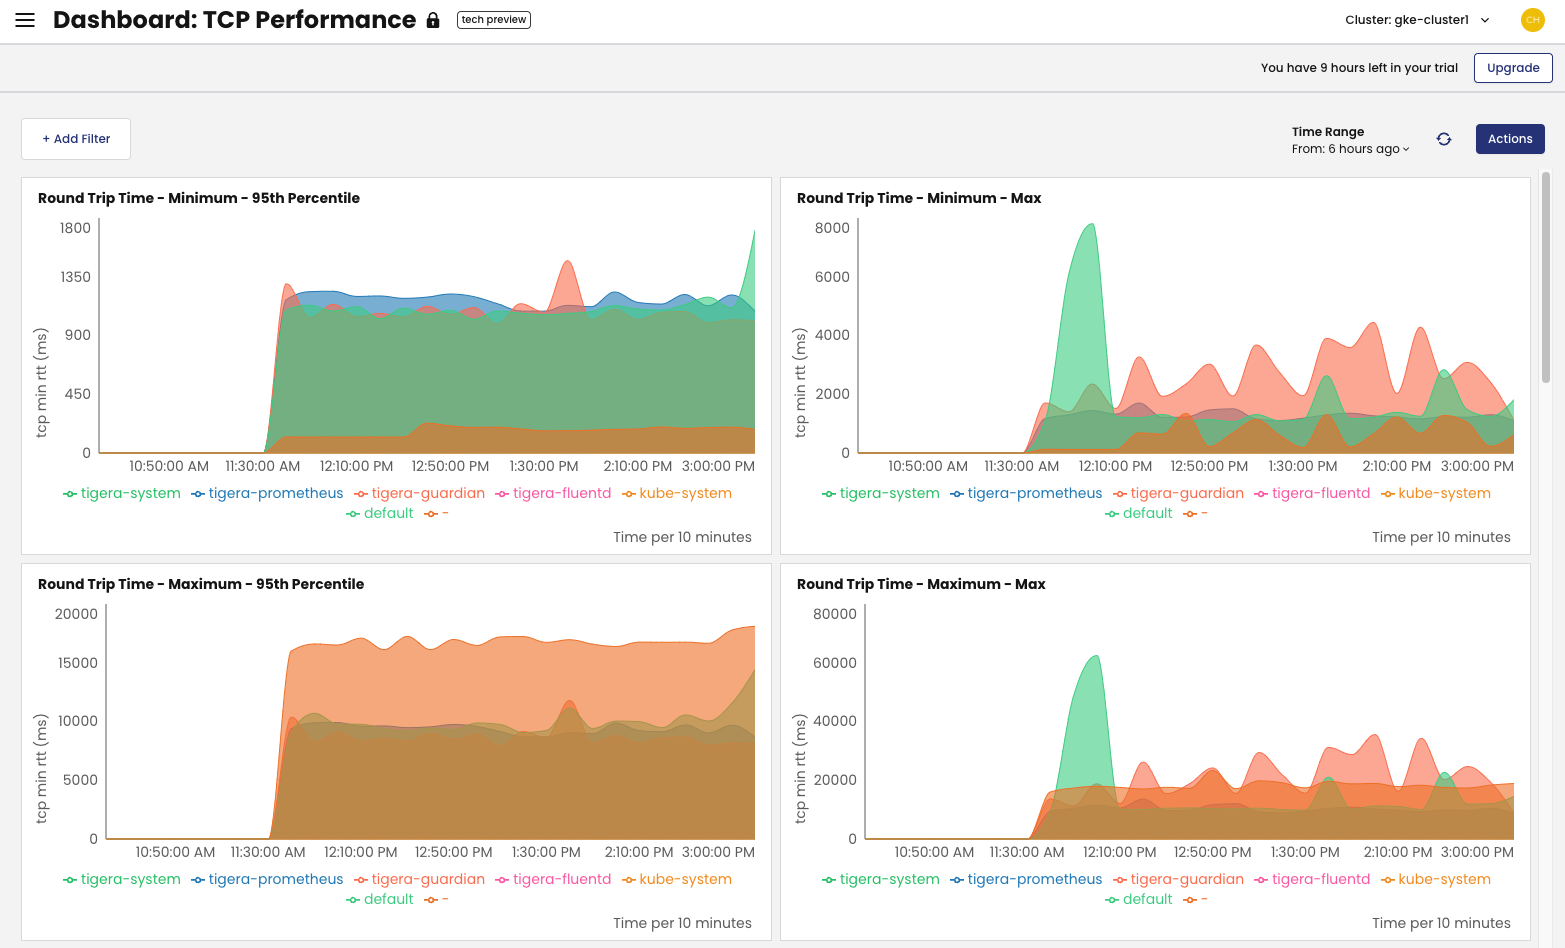
Network Performance
The Network Performance dashboard provides TCP metrics to help you identify bottlenecks, packet loss, and performance issues. Additional TCP statistics such as Round Trip Time, Retransmission and Packet Loss are not enabled by default, and must be configured.