Audit logs
Big picture
Calico Cloud audit logs provide security teams and auditors historical data of all changes to resources over time.
Concepts
Resources used in audit logs
Calico Cloud audit logs are enabled by default for the following resources:
- Global networkpolicies
- Network policies
- Staged global networkpolicies
- Staged networkpolicies
- Staged Kubernetes network policies
- Global network sets
- Network sets
- Tiers
- Host endpoints
Audit logs in the web console
Calico Cloud audit logs are displayed in the Timeline dashboard in the web console. You can filter logs, and export data in .json or .yaml formats.
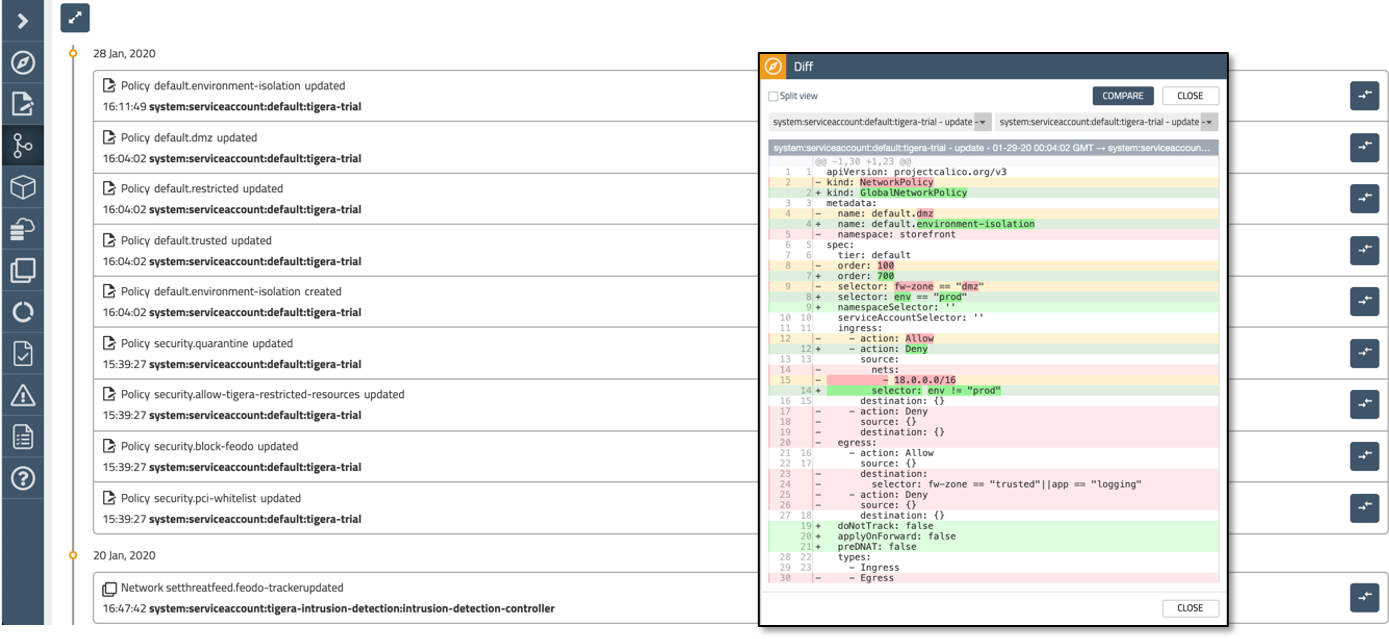
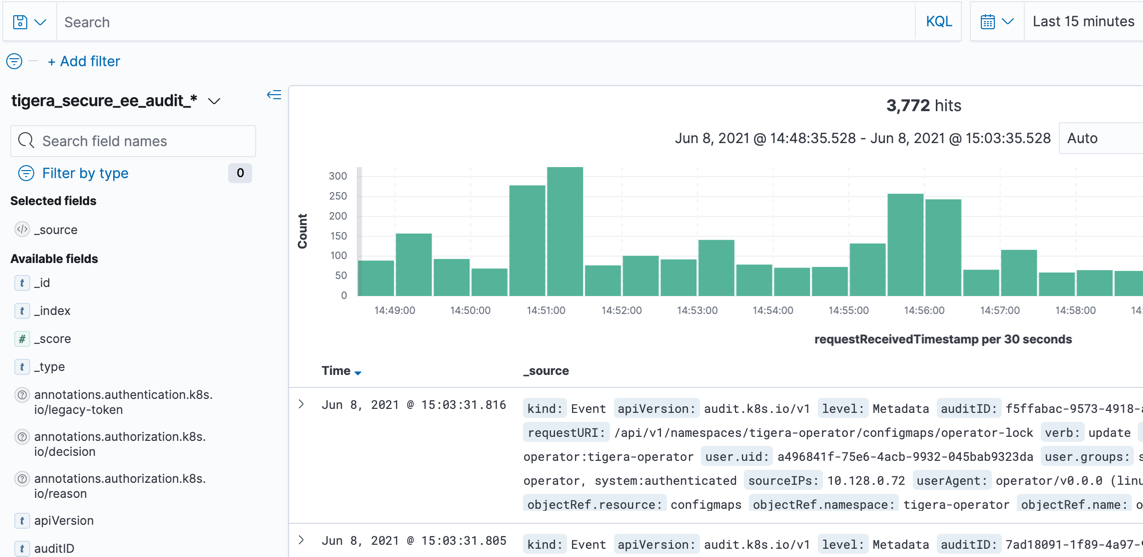
Audit logs are also visible in the Kibana dashboard (indexed by, tigera_secure_ee_audit_ee), and are useful for looking at policy differences.
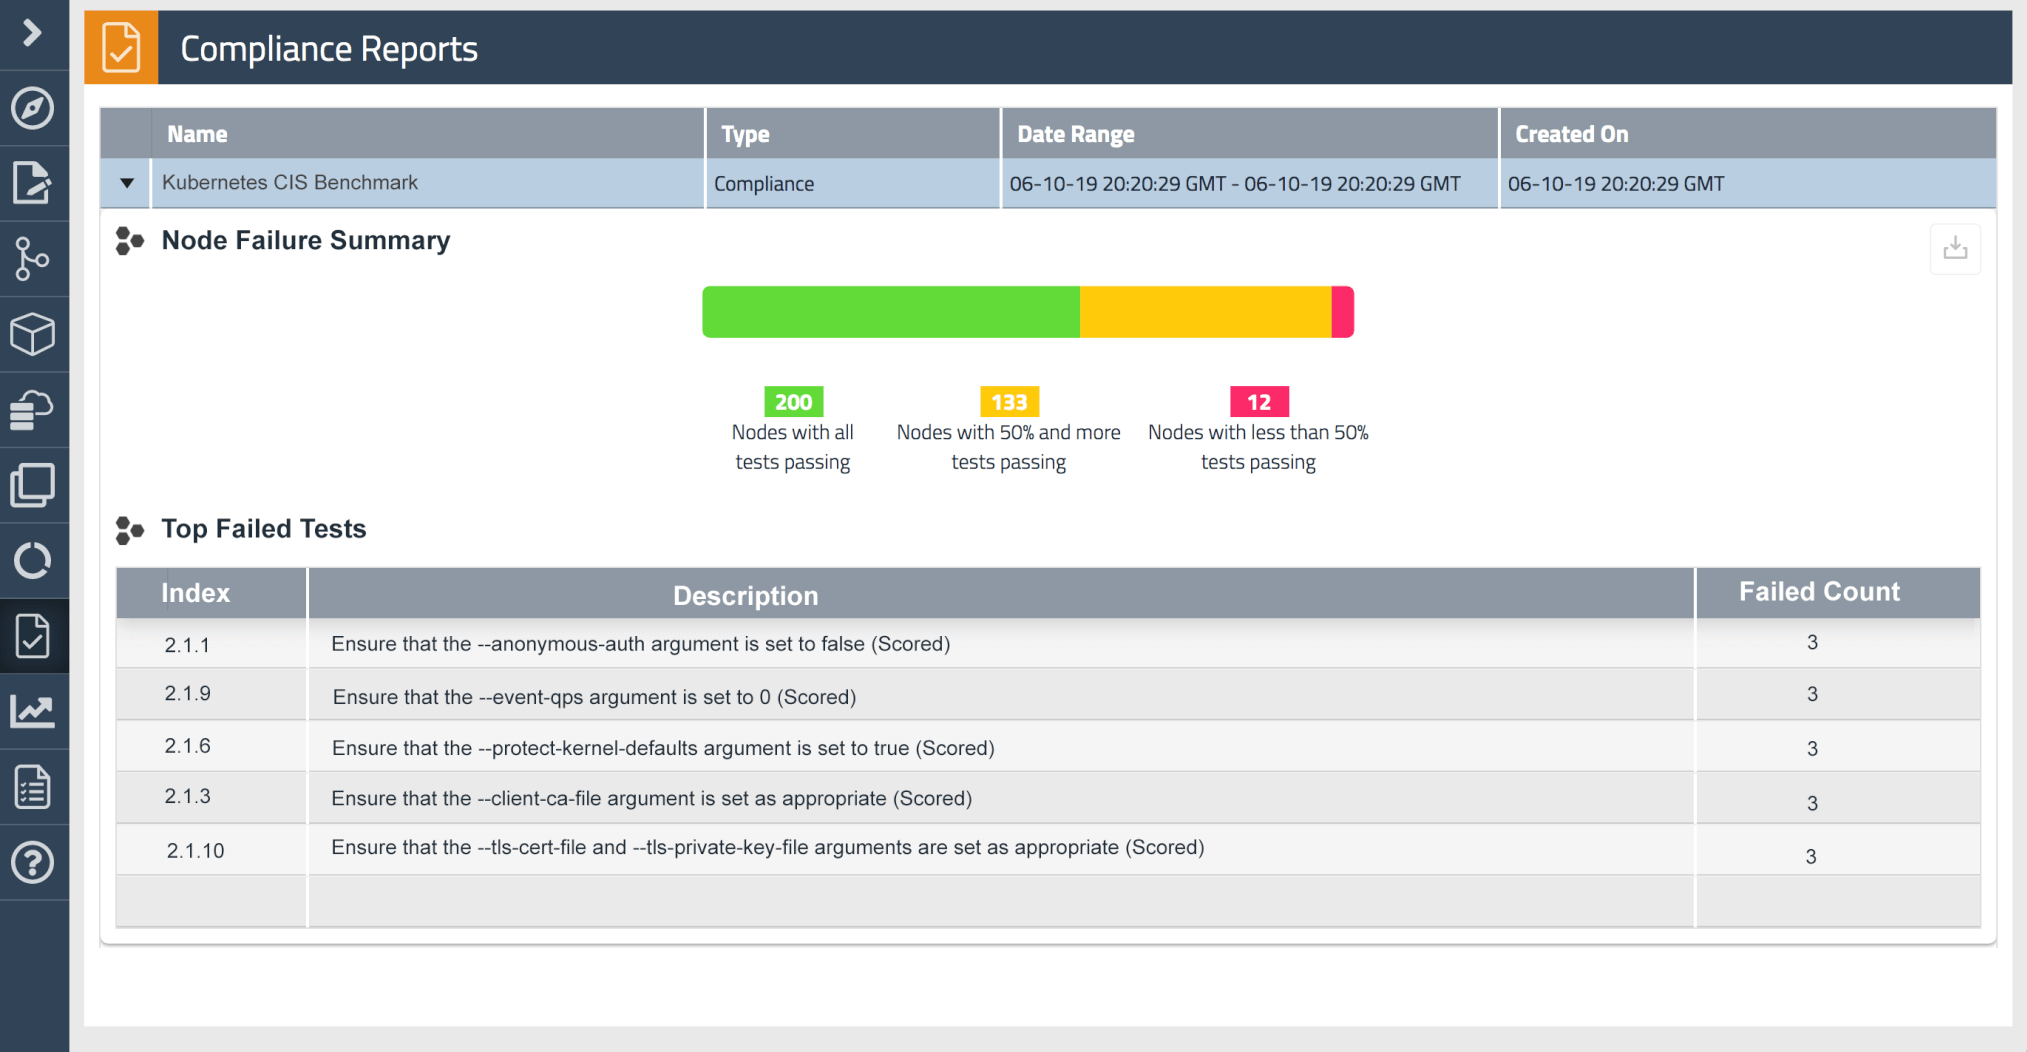
Finally, audit logs provide the core data for compliance reports.
Required next step
Kubernetes resources are also used in compliance reports and other audit-related features, but they are not enabled by default. You must enable Kubernetes resources through the Kubernetes API server. If you miss this step, some compliance reports will not work, and audit trails will not provide a complete view to your security team.